Jeremy Lagache

The Live Blog

I document my projects here: technical choices, features, challenges and pivots. LivePLC (industrial SCADA / HMI), Hataline (CMMS), Qwipment (equipment management via QR codes). Three tools born from the same real-world need.

Regularly updated by Jeremy Lagache

LivePLC, "Why not?"

Context

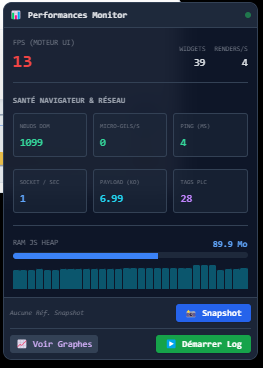
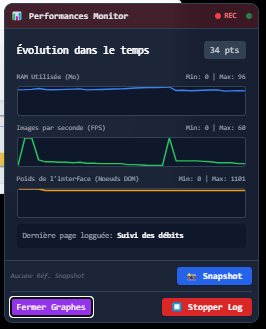
For five years now, in the factory where I work, production orders have been sent to the production line through manual operator input. Five years of potential data entry errors, non-conforming products, and daily friction that everyone has eventually come to accept as inevitable. Not to mention the slowdowns that had gradually crept into our supervision systems as updates accumulated and production tools were added — values were slow to refresh.

As an automation engineer and maintenance technician for over twenty years, I naturally look for concrete solutions. Before going it alone, I had tried the official route: the parent company has a team of engineers specialised in this kind of topic. We had direct contact with them, shared all the data, programs and specifications. A year later — nothing. Probably a matter of priorities, staff turnover, or simply the fact that they mostly work on recent Siemens environments rather than ageing Schneider installations that weren't really in their wheelhouse... or perhaps they were looking for a more global vision of replacing PLCs and supervision systems with no one really knowing where things stand. So I decided to tackle the problem myself.

To do that, I needed two things:

1 Retrieve the SAP data

Production order files are automatically exported to a server as text files.
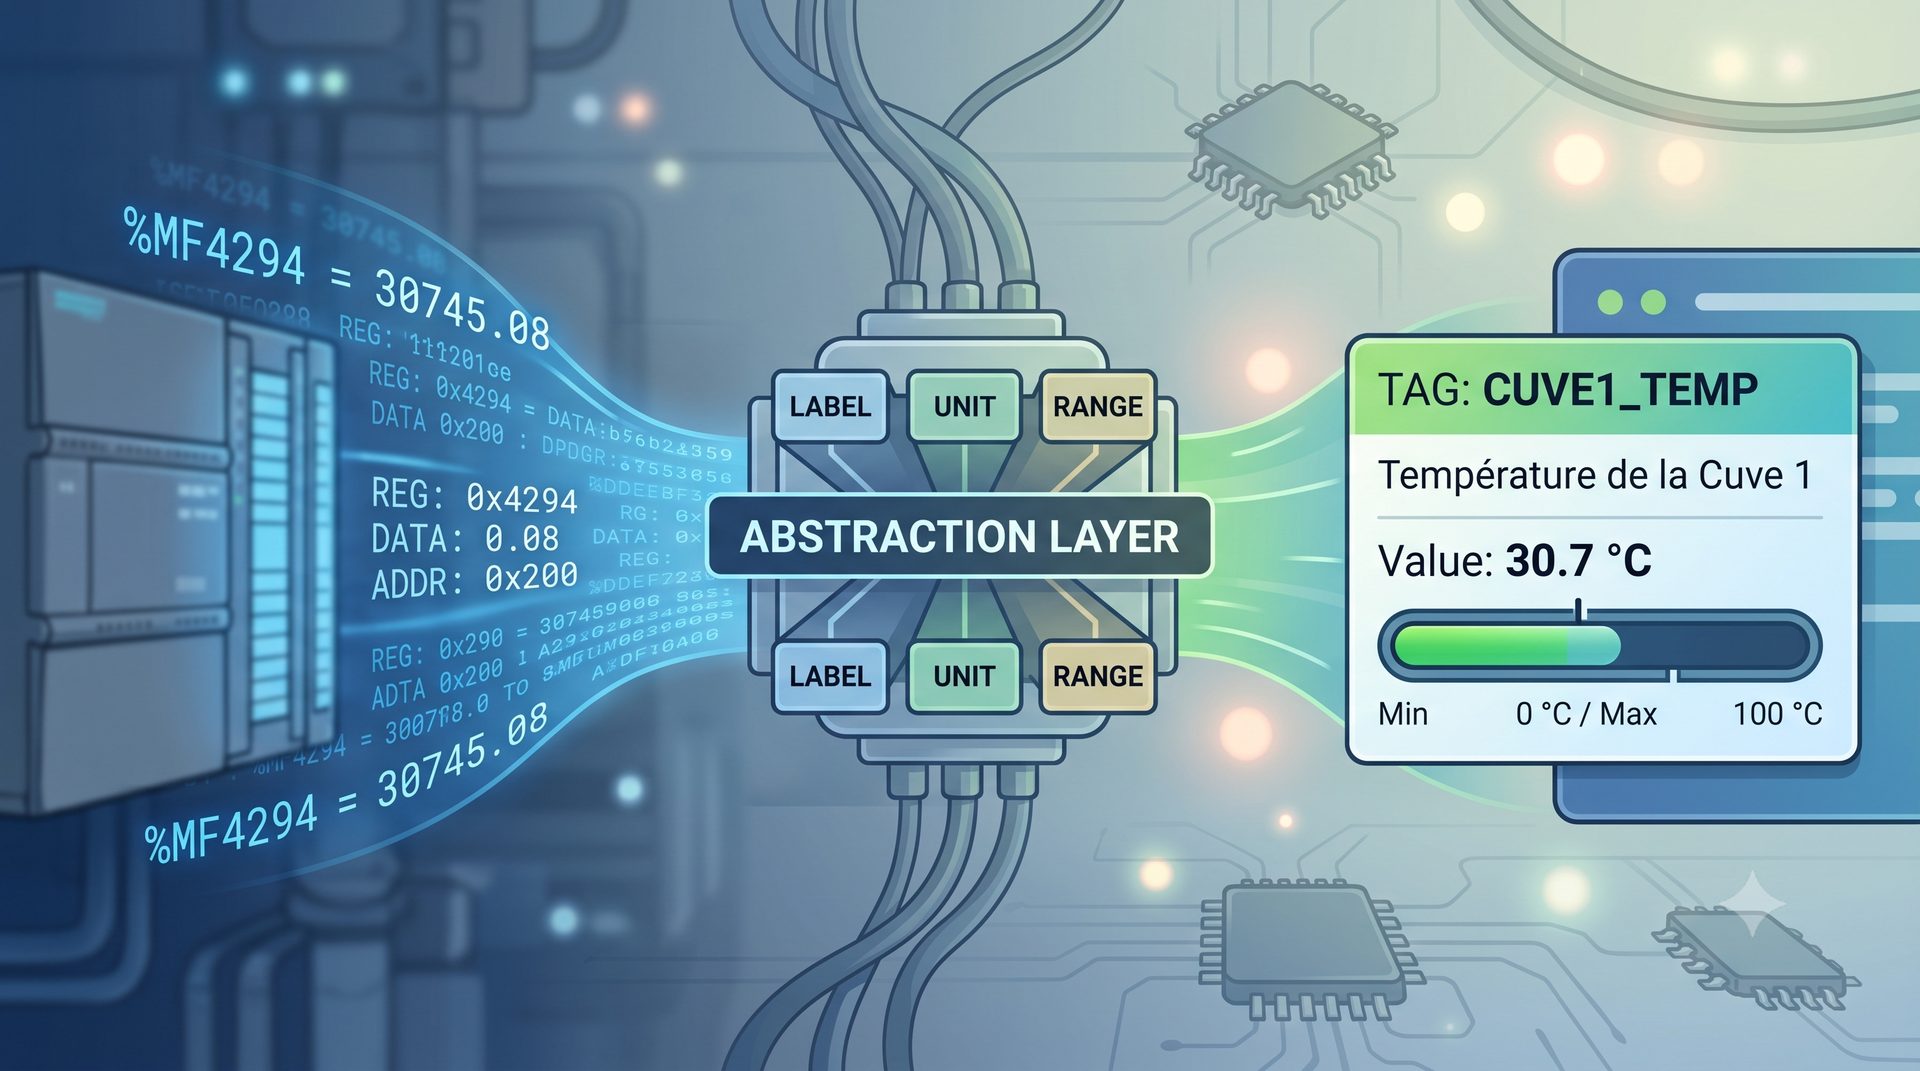
Text parser · known ground
2 Transfer to the supervision system

Transfer this formatted data to the supervision workstation, which communicates with a Schneider PLC.

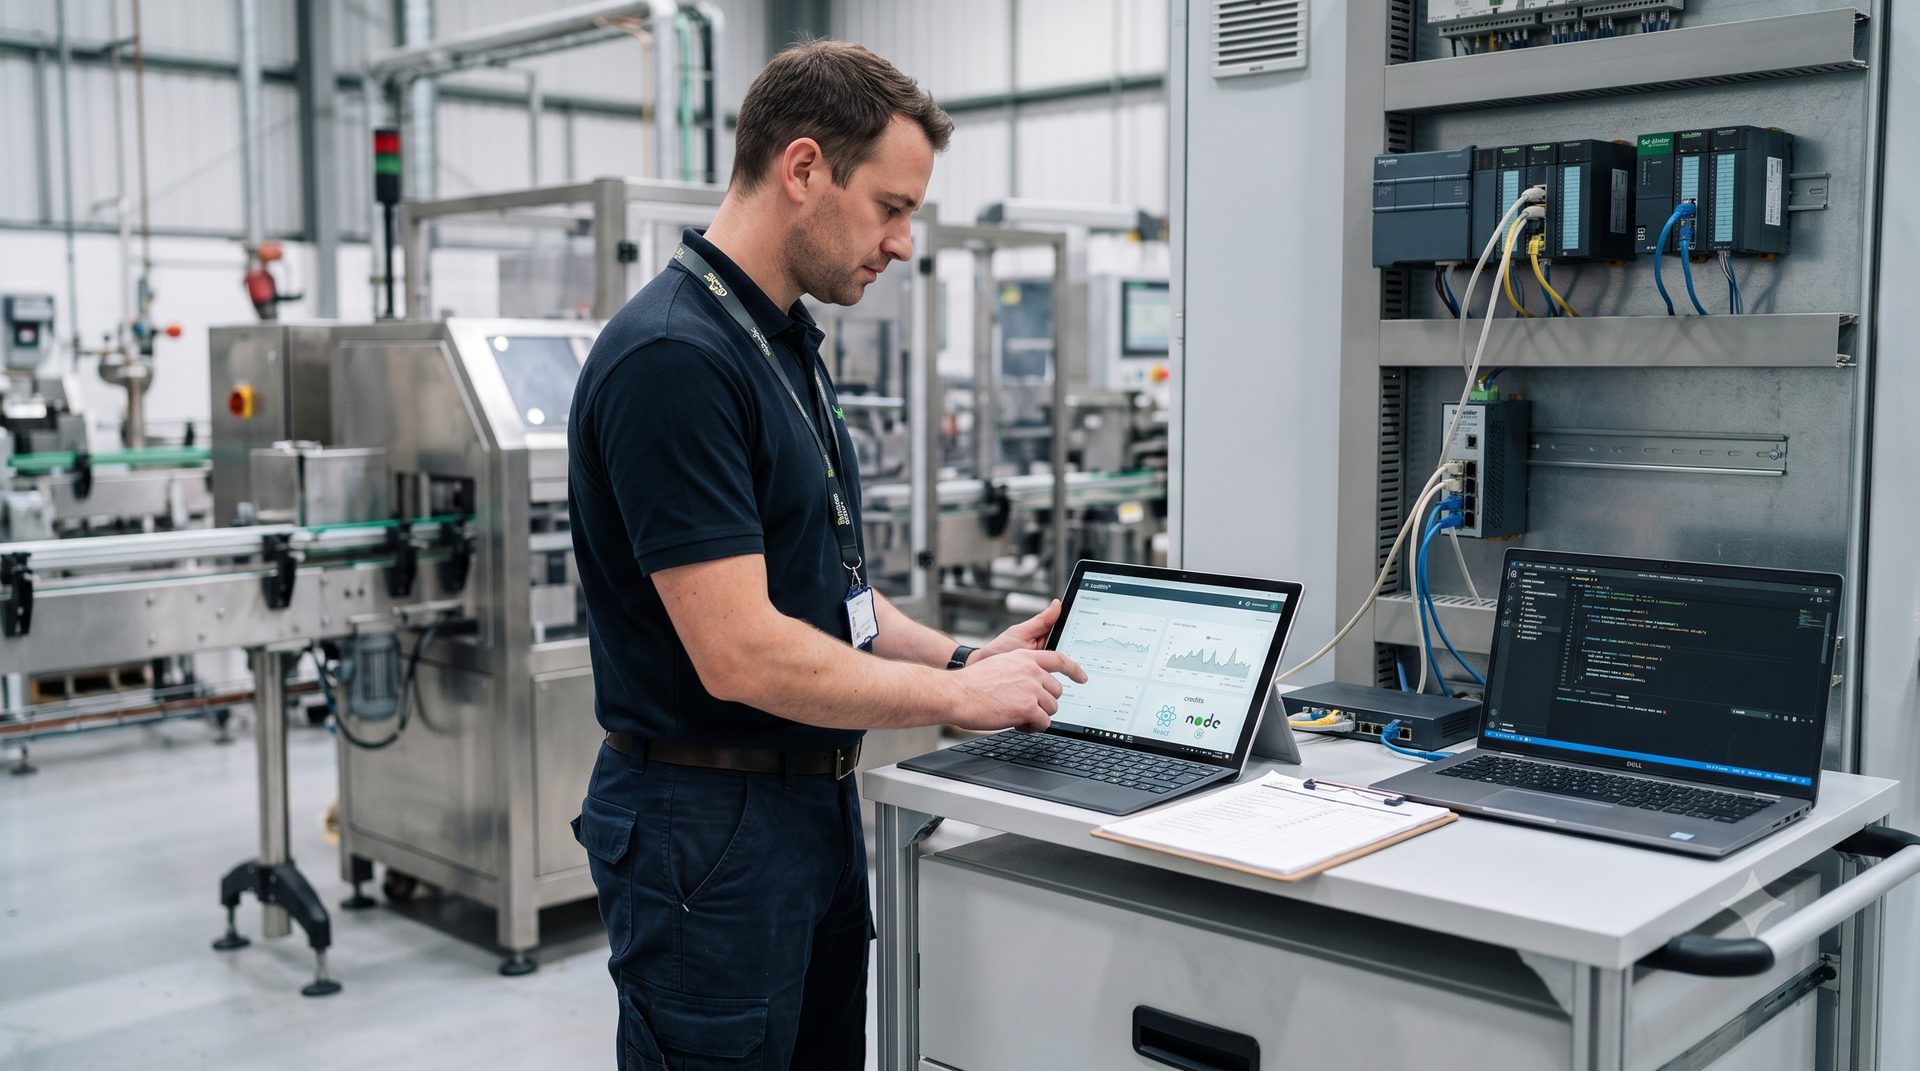
PC <> Schneider Premium PLC communication · uncharted territory

Rather than using the classic industrial approach for this type of application — a compiled Delphi or C++ program interfaced with the PLC — I wondered whether I could use more open and modern tools: Node.js on the server side, React on the interface side, as these were trending tools I had started using the previous year on a personal maintenance management project.

The motivation: solving a concrete problem, and discovering there was something bigger to build

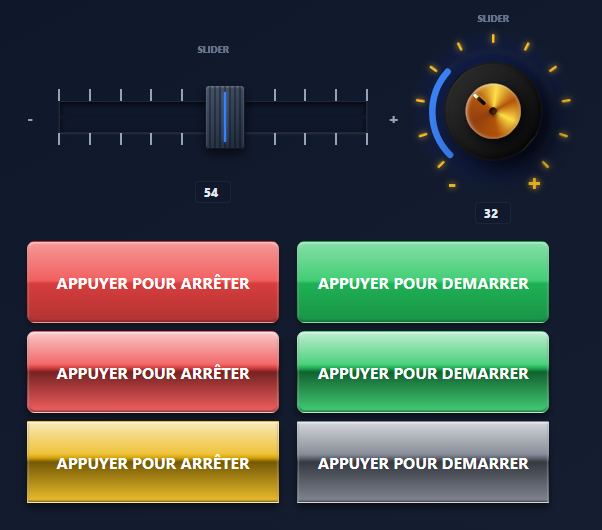
Two hours of research later, what I thought would take two weeks came down to a single realisation: "But is that all there is to it?" From my personal computer, with a small rudimentary interface, I could directly read and write memory words %MWxxxx on a Schneider Premium PLC. And from there, everything fell into place very quickly in my head.

"Why not?" — If I can talk to a PLC from my PC in a few hours, what could I build with a few weeks of work?

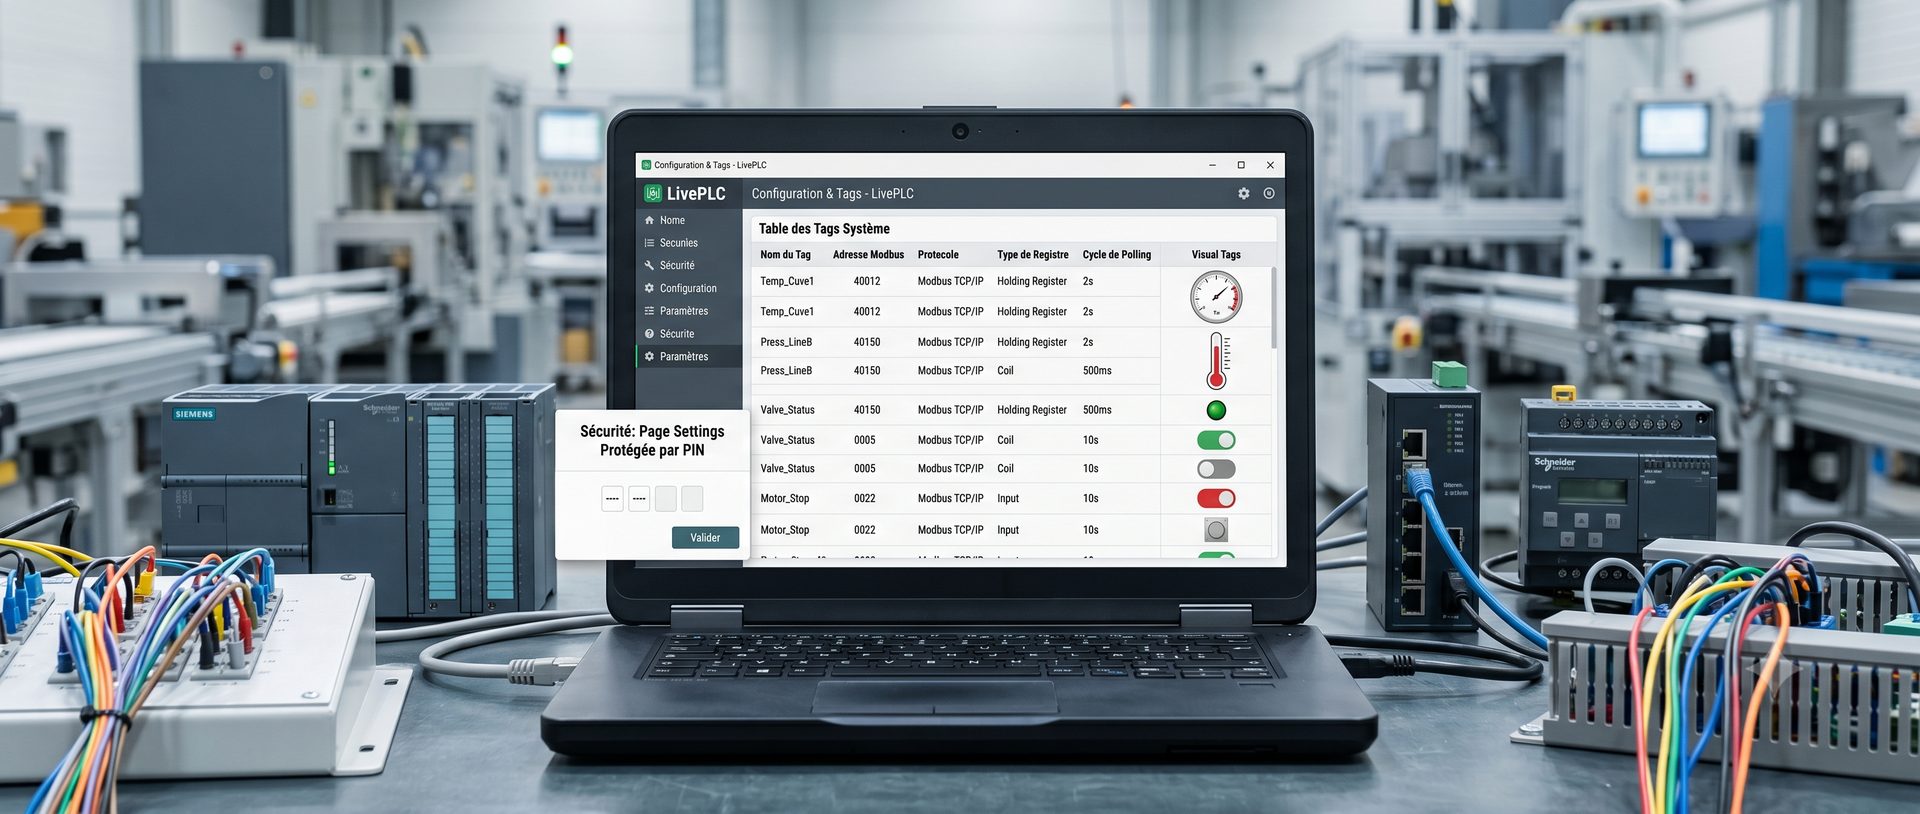
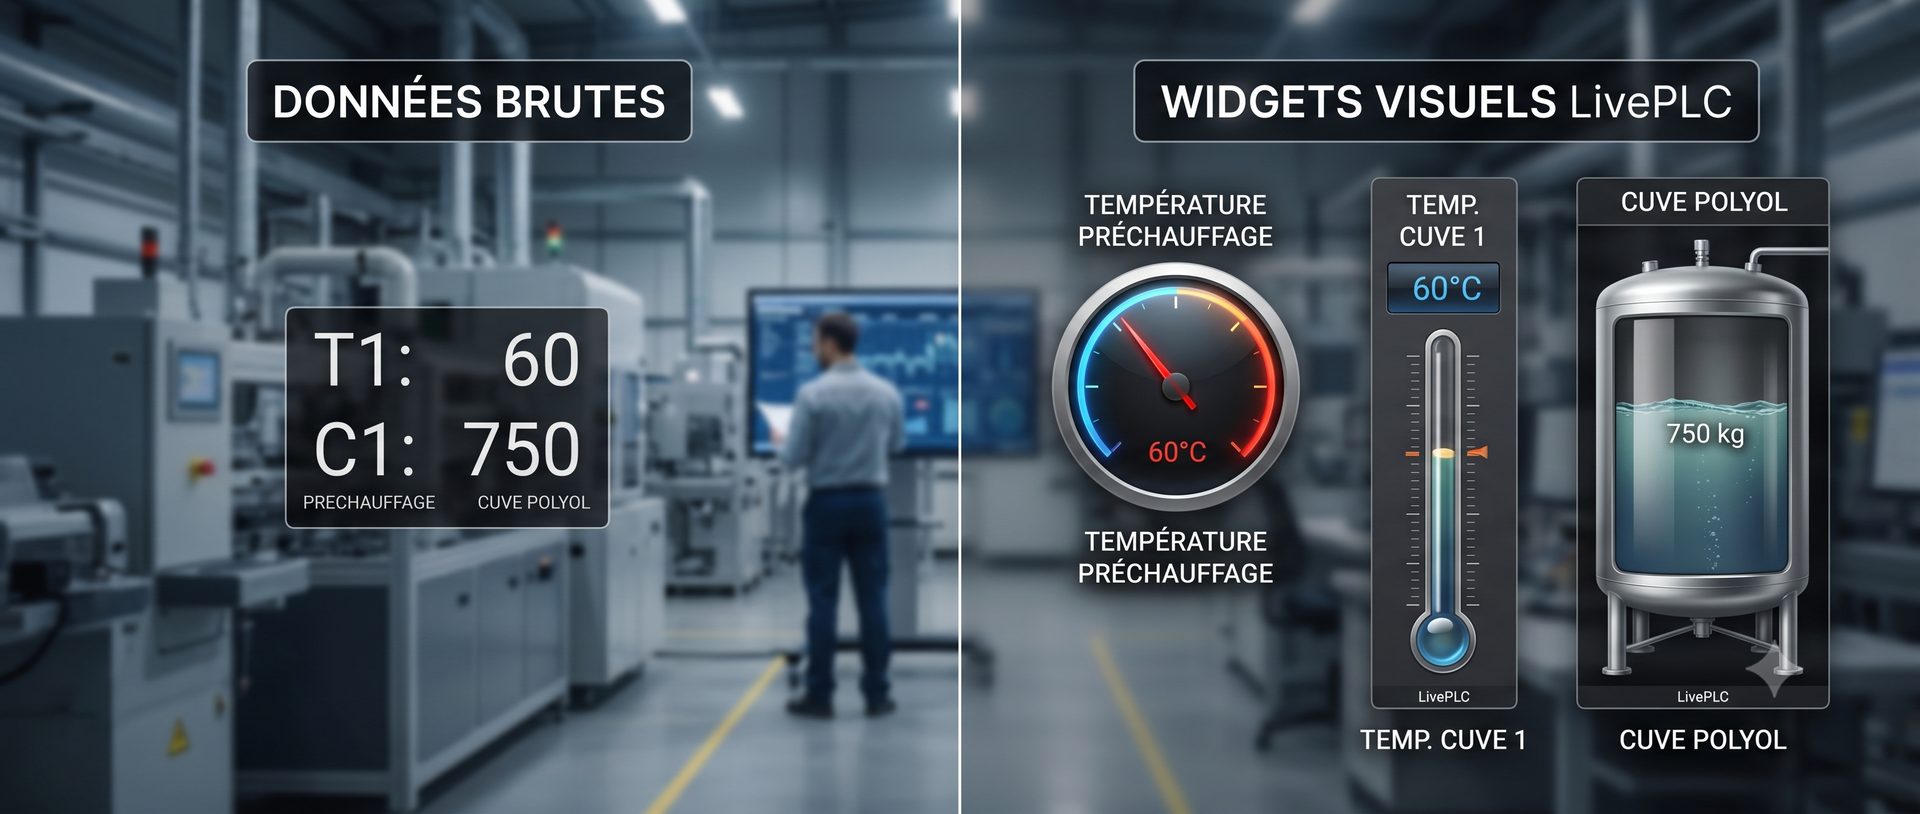
I was now convinced that I could do something bigger. Not just solve this data entry problem — but tackle a frustration I had carried for years in my profession: industrial supervision tools cost a fortune, run on locked proprietary platforms, and whenever we need to replace a PC with a higher OS version, you have to migrate to a new version of the HMI software with licences to update, hours of supervision program migration to plan, licensing tools that require as much training as the software itself — and whenever you want to customise something beyond what the vendor has anticipated, it's either impossible or a week's work in a 1990s language. I've used WinCC, InTouch — solid tools, but closed, and often out of reach for smaller companies due to their cost.

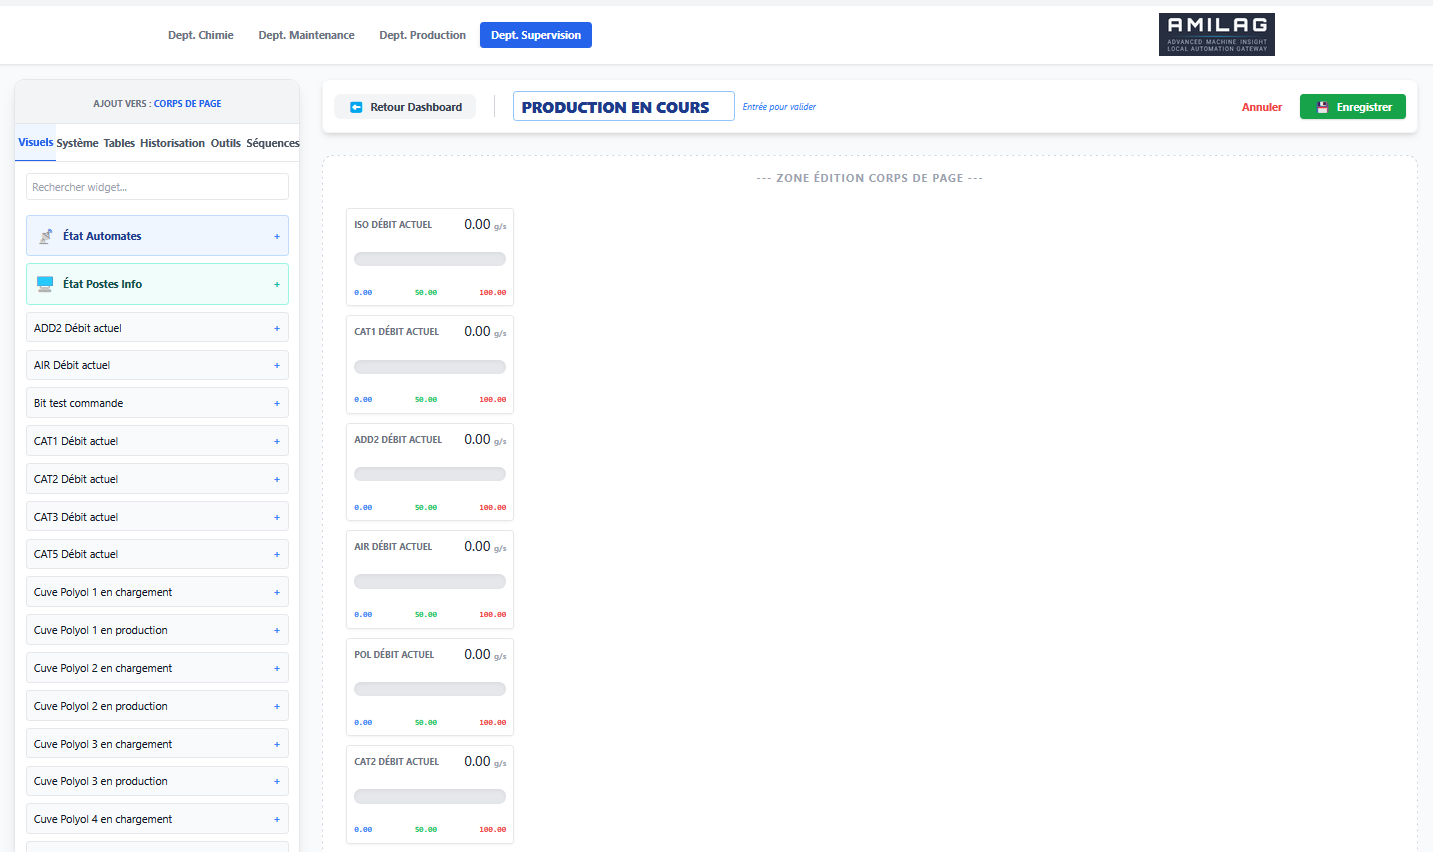
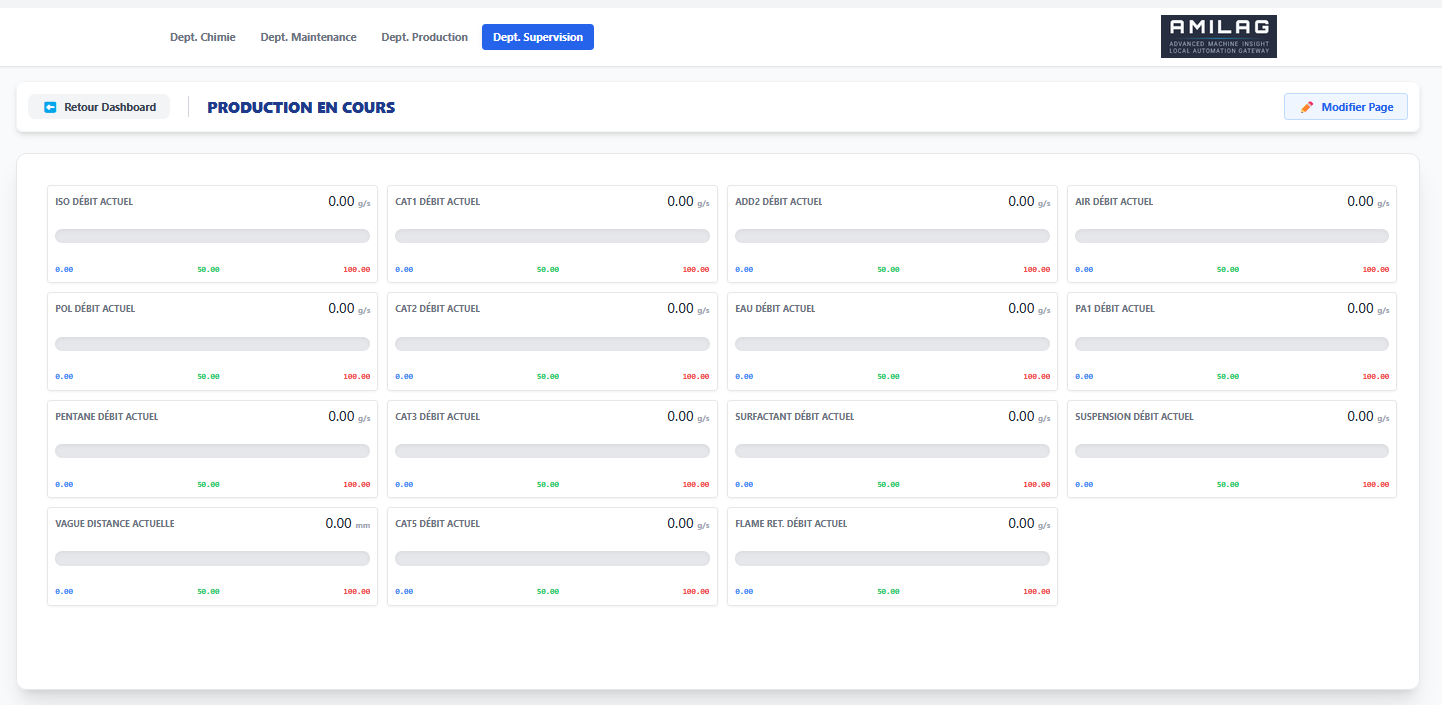
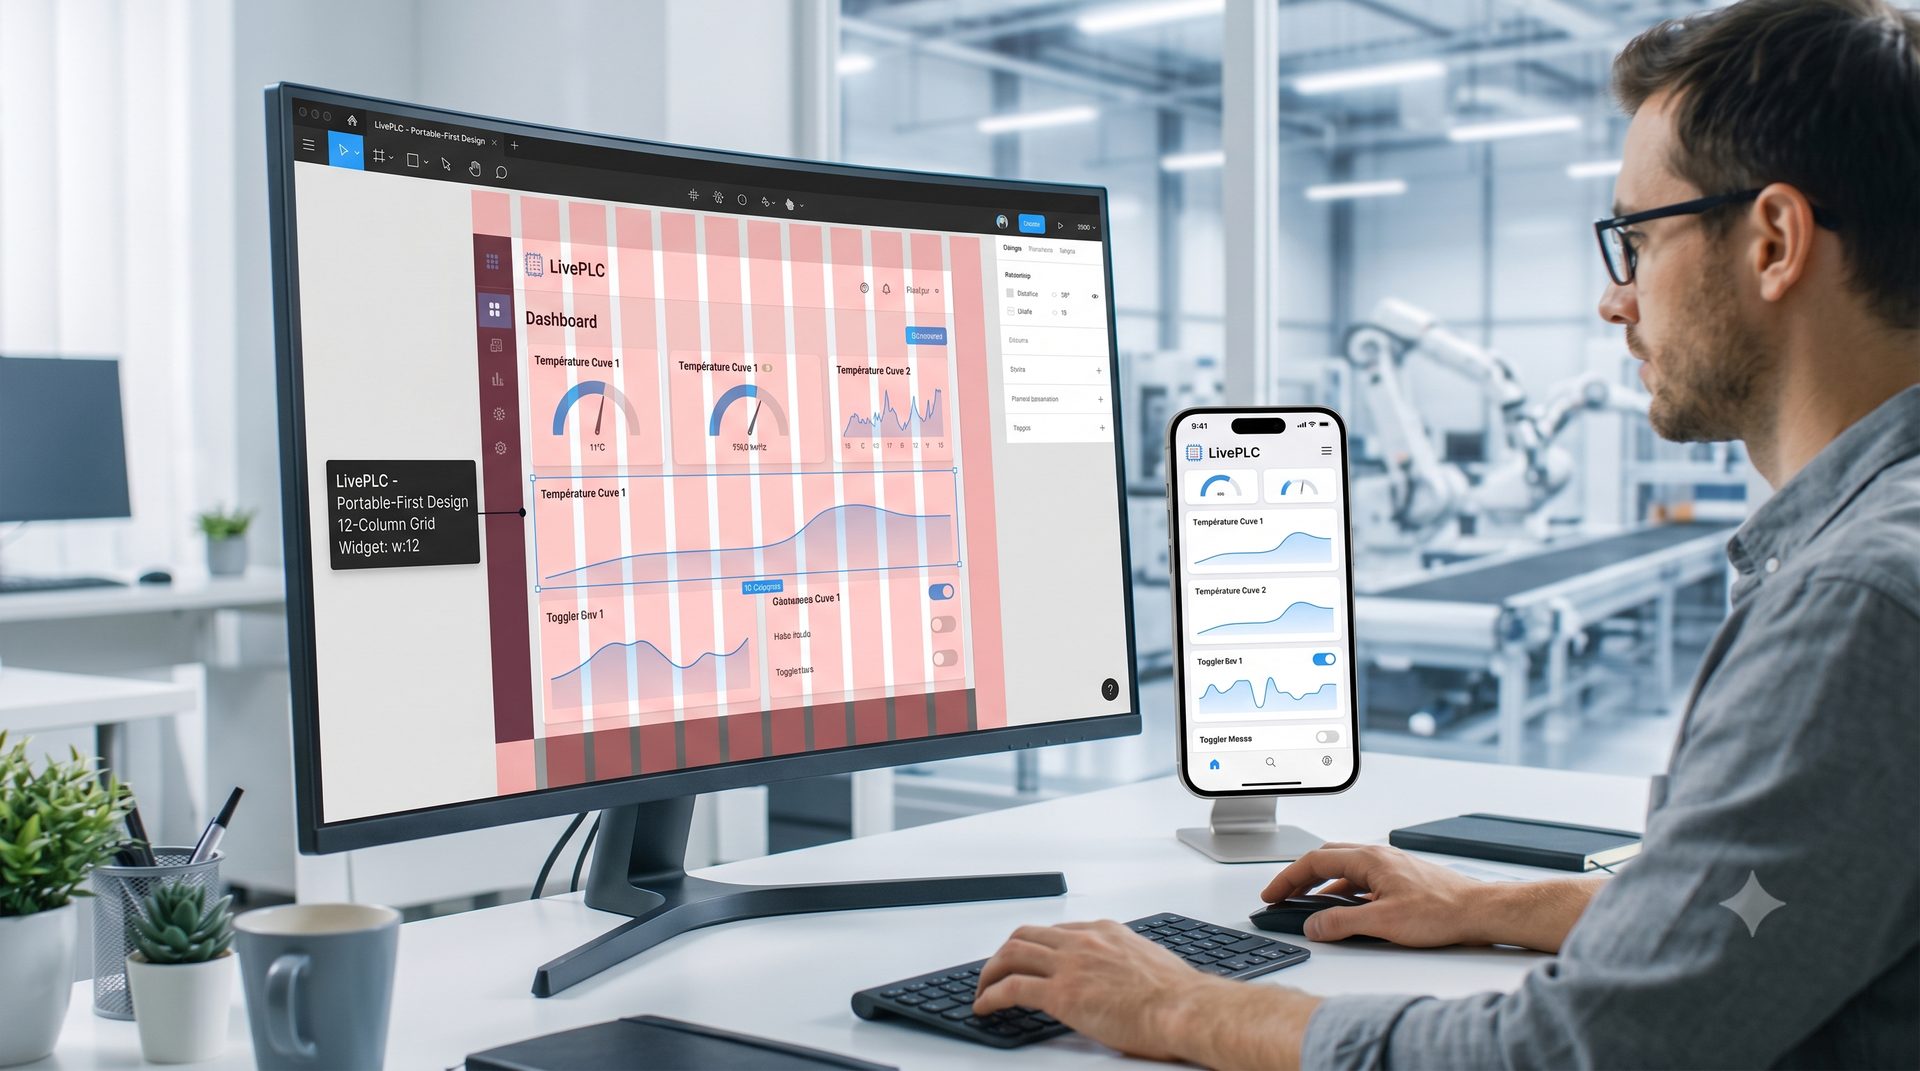
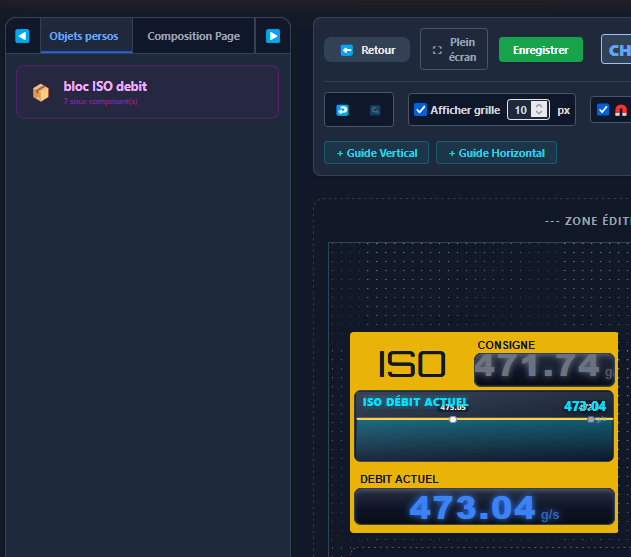
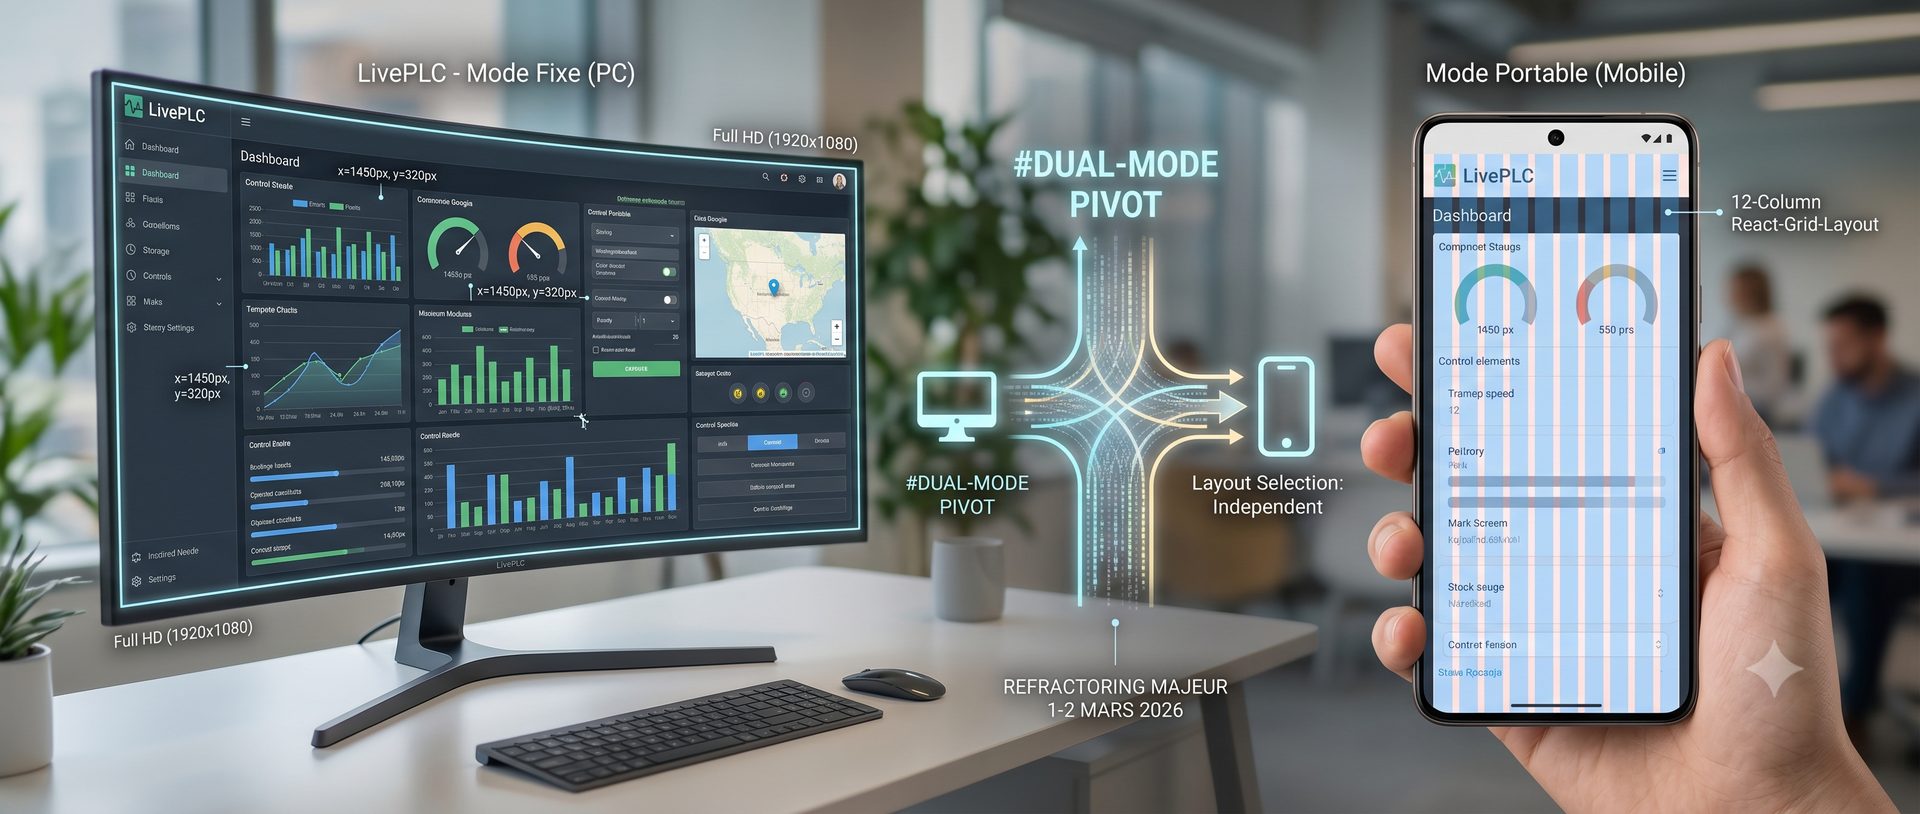
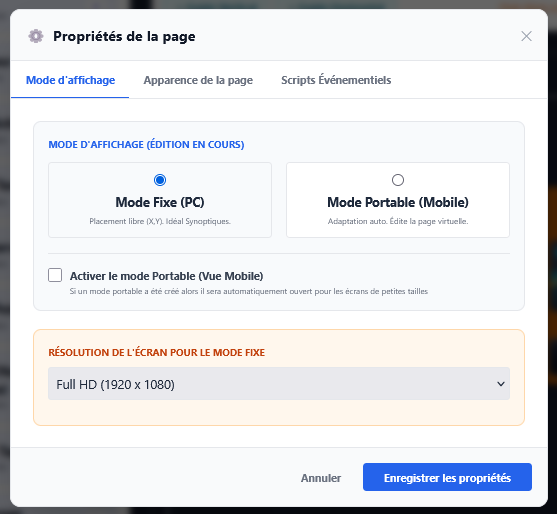
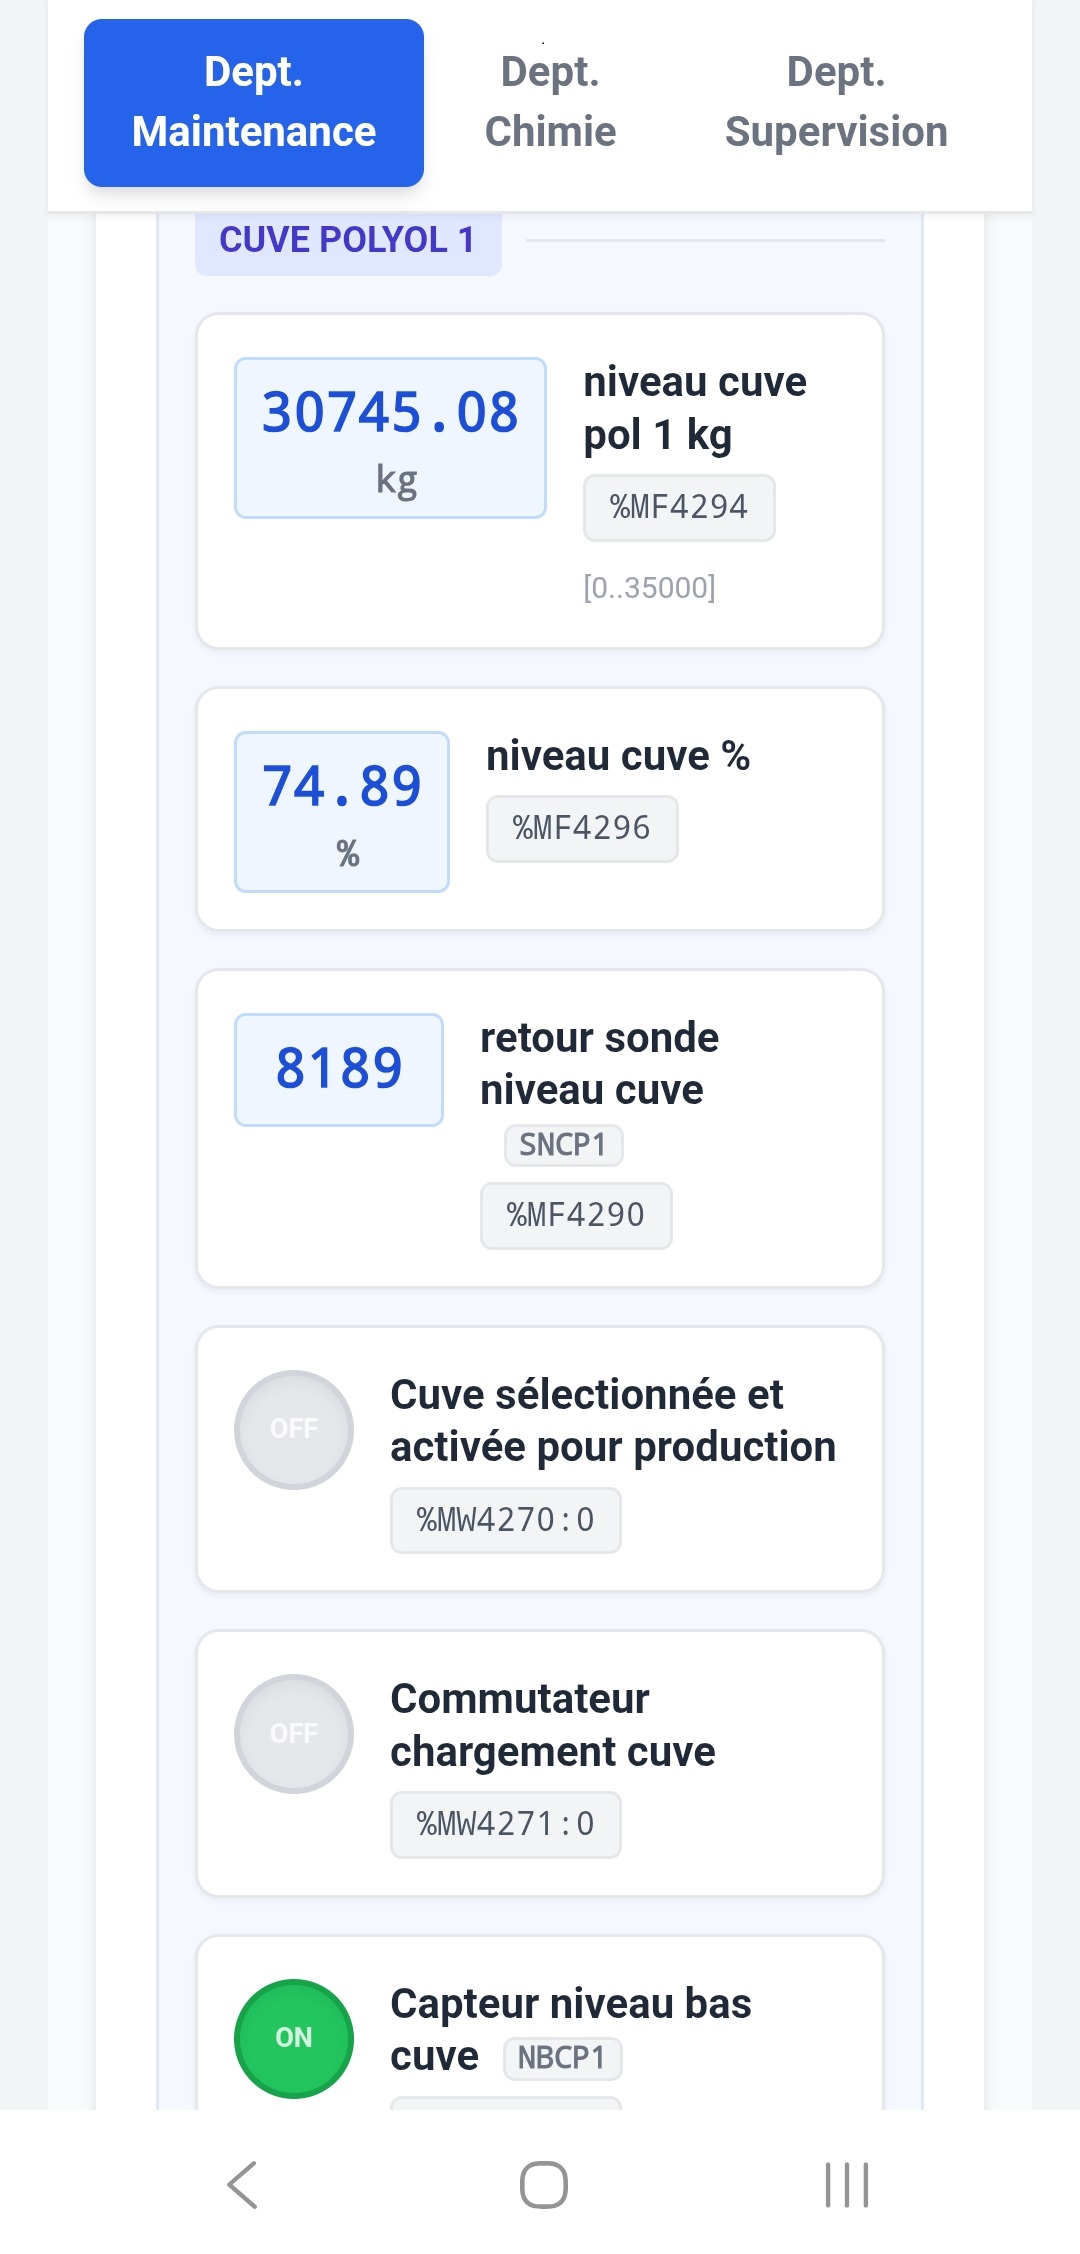
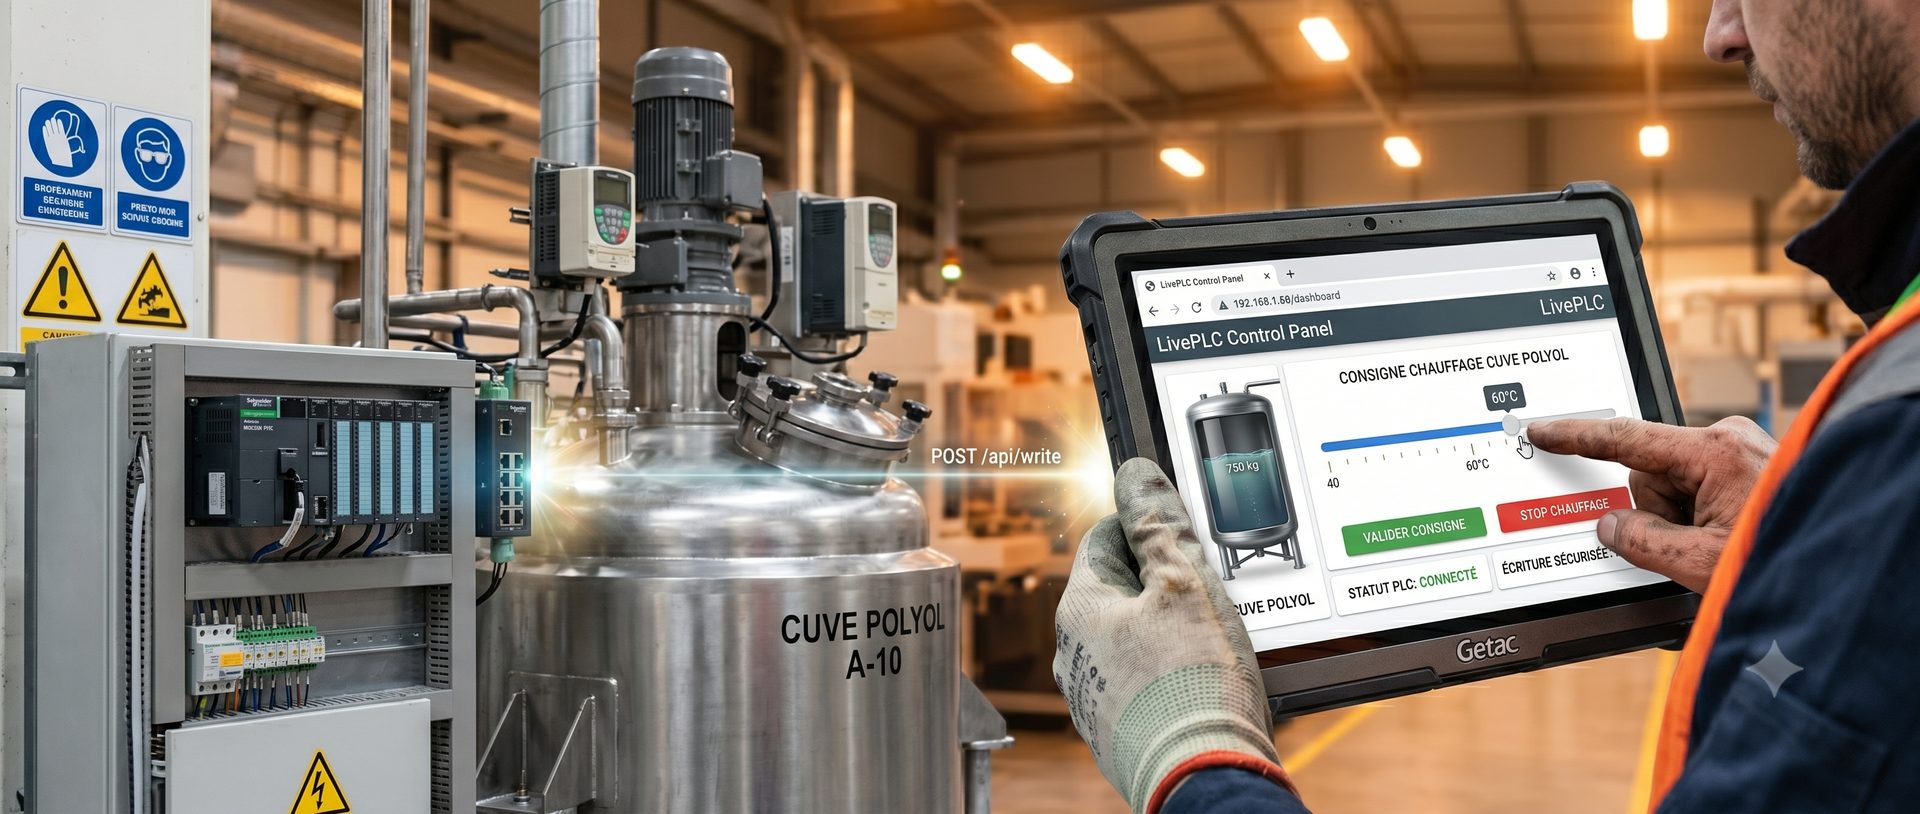
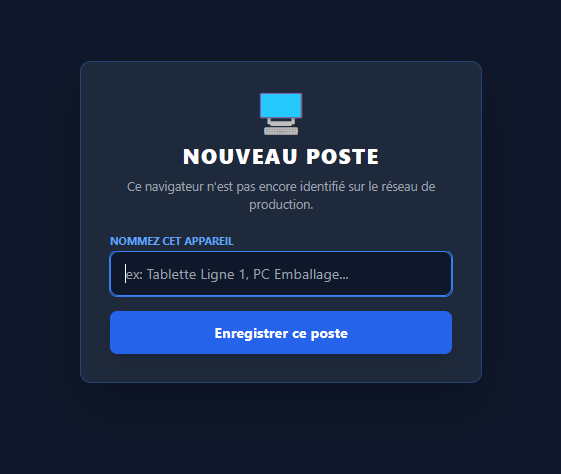
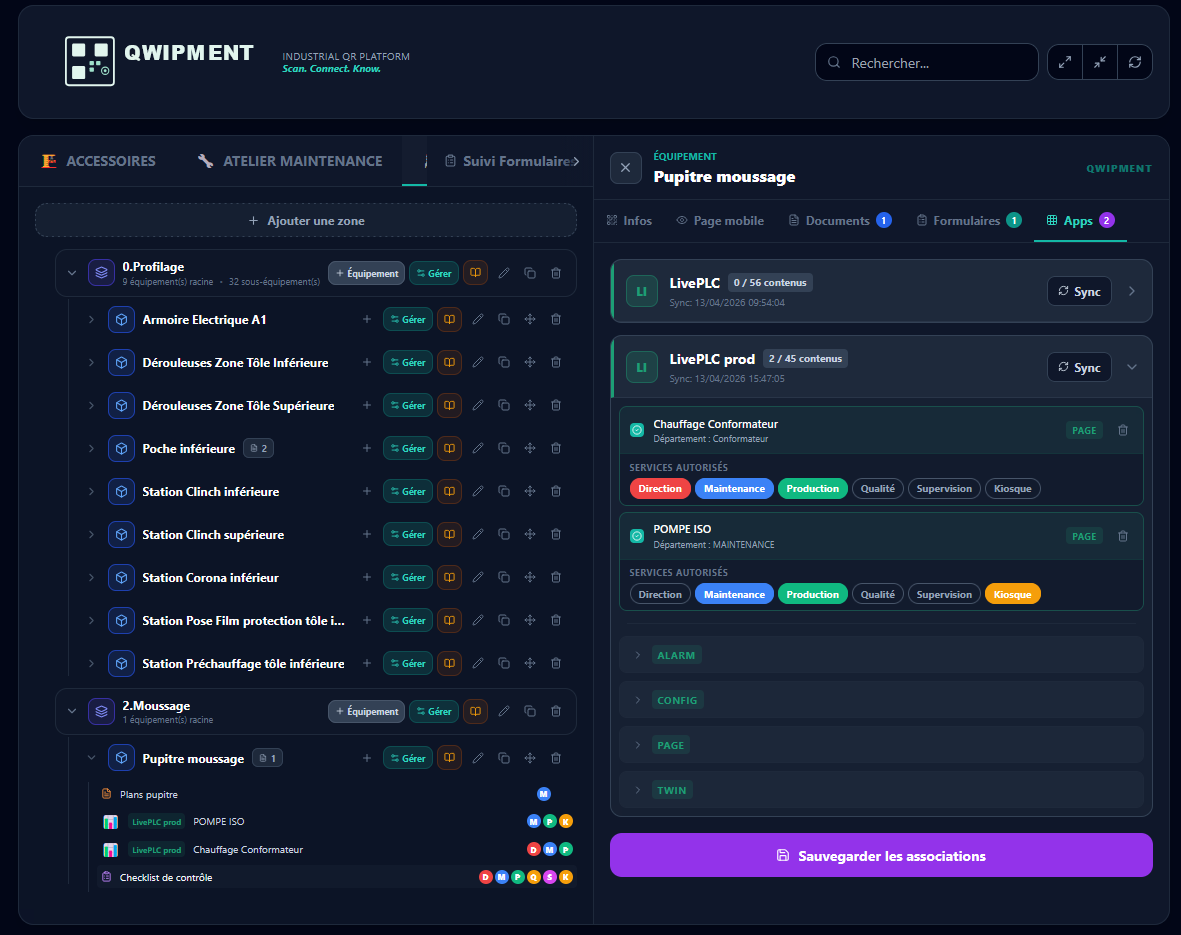
The idea became clear: what if I built a supervision interface as flexible as a website, connected directly to the PLCs, and accessible from any screen — including the smartphone in your pocket on the shop floor? If a workstation needs replacing, no more migration, no more spending hours reinstalling everything with a systems engineer. With this setup: a browser and a local web address, and you're back up and running!

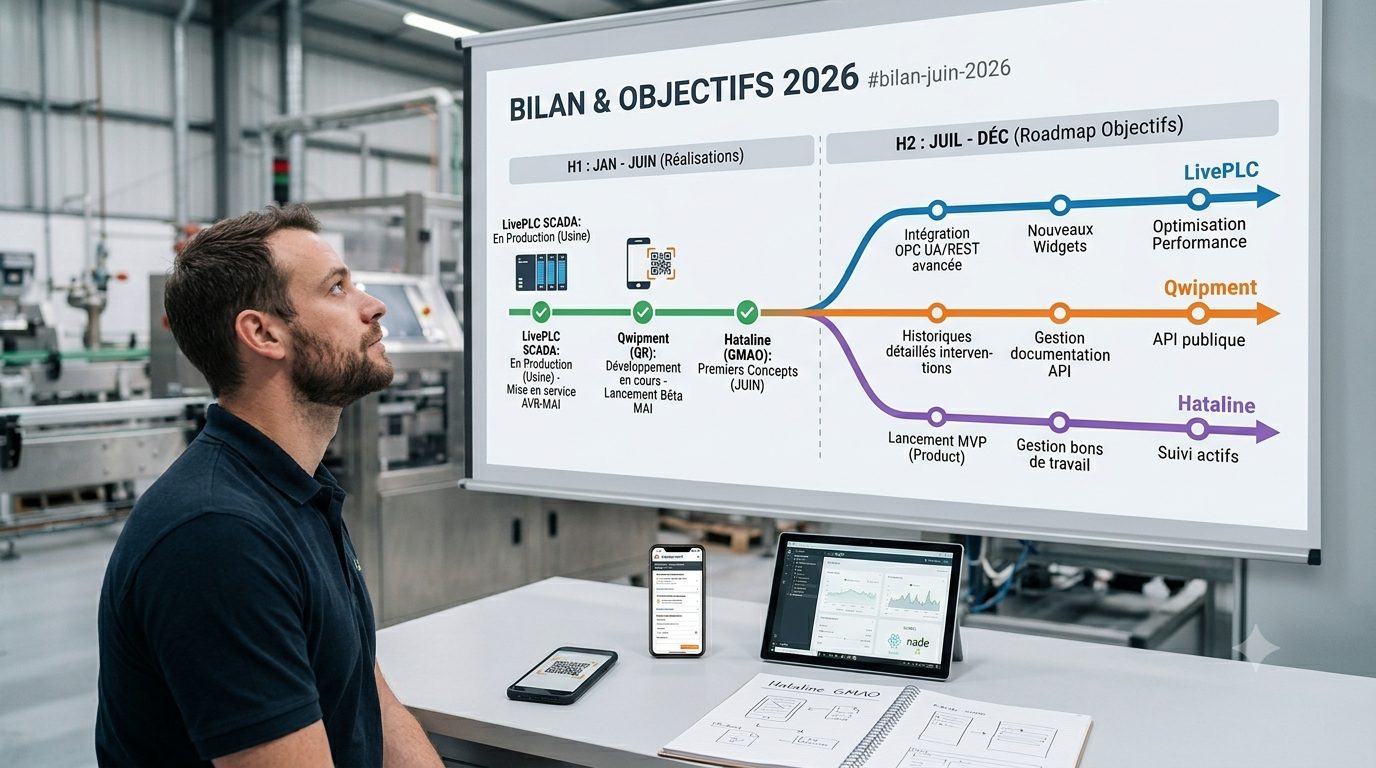
The vision and action plan

Technicien de maintenance devant une cuve industrielle

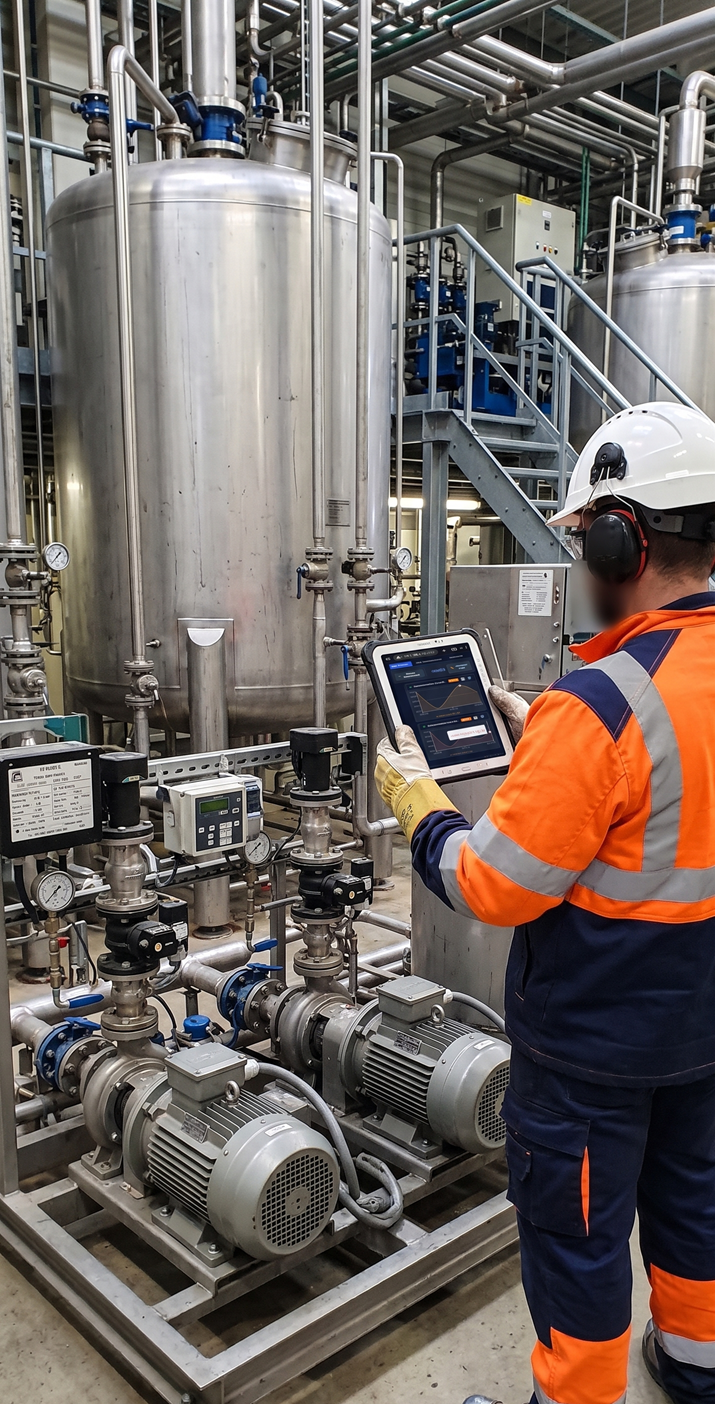
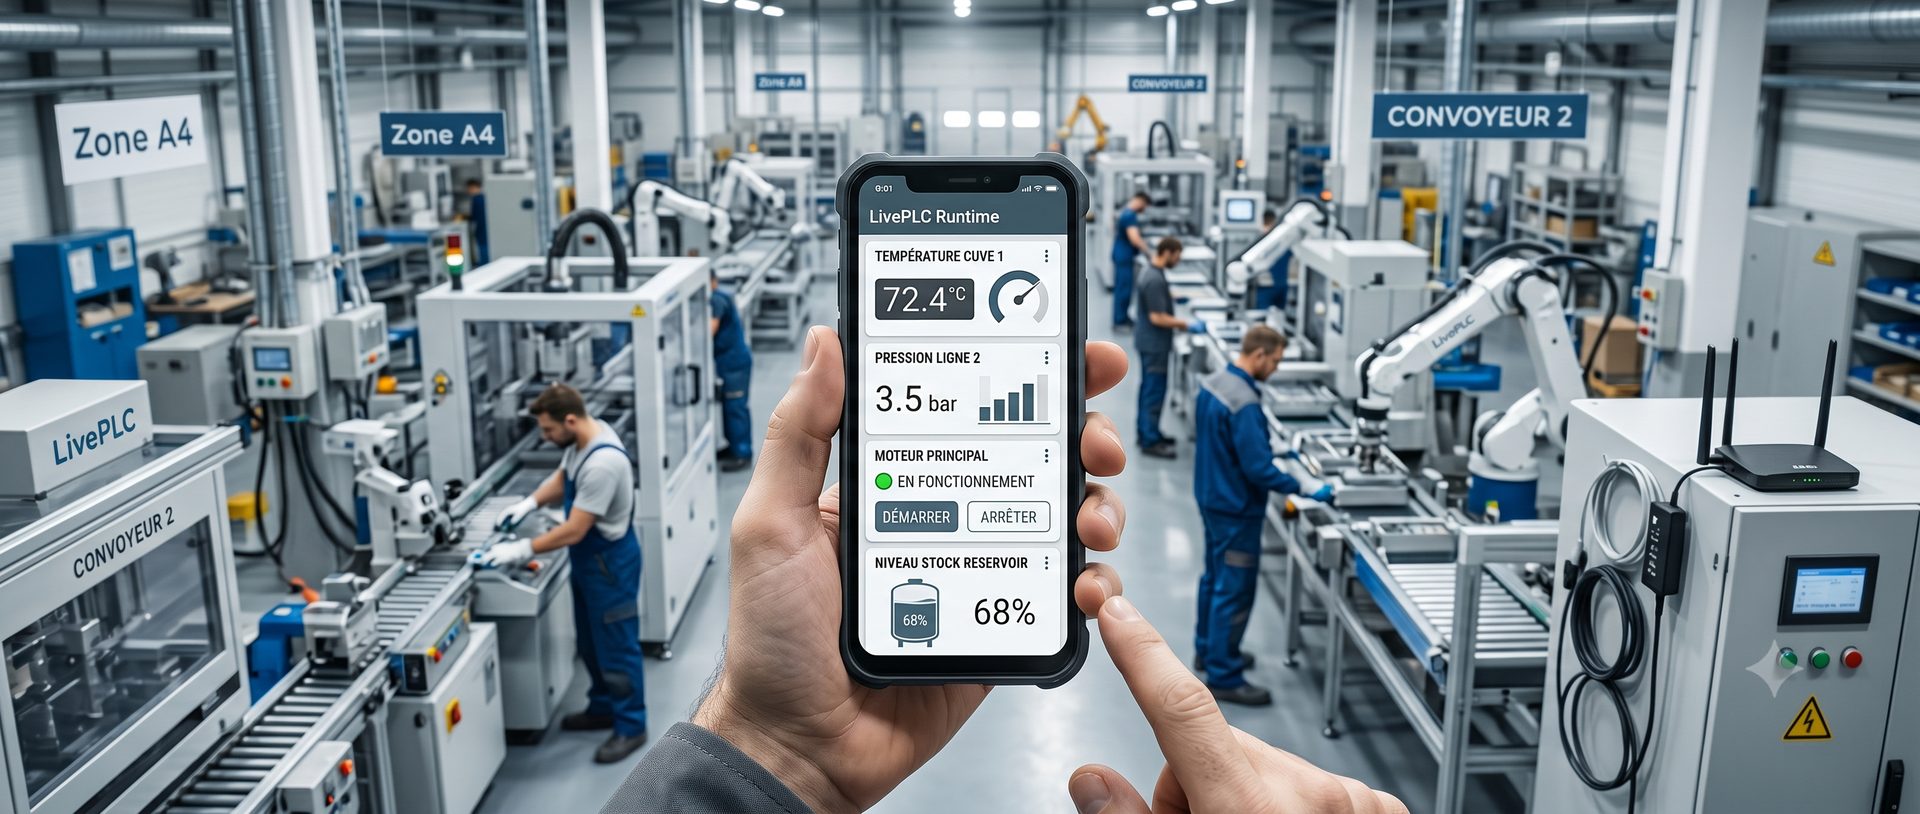
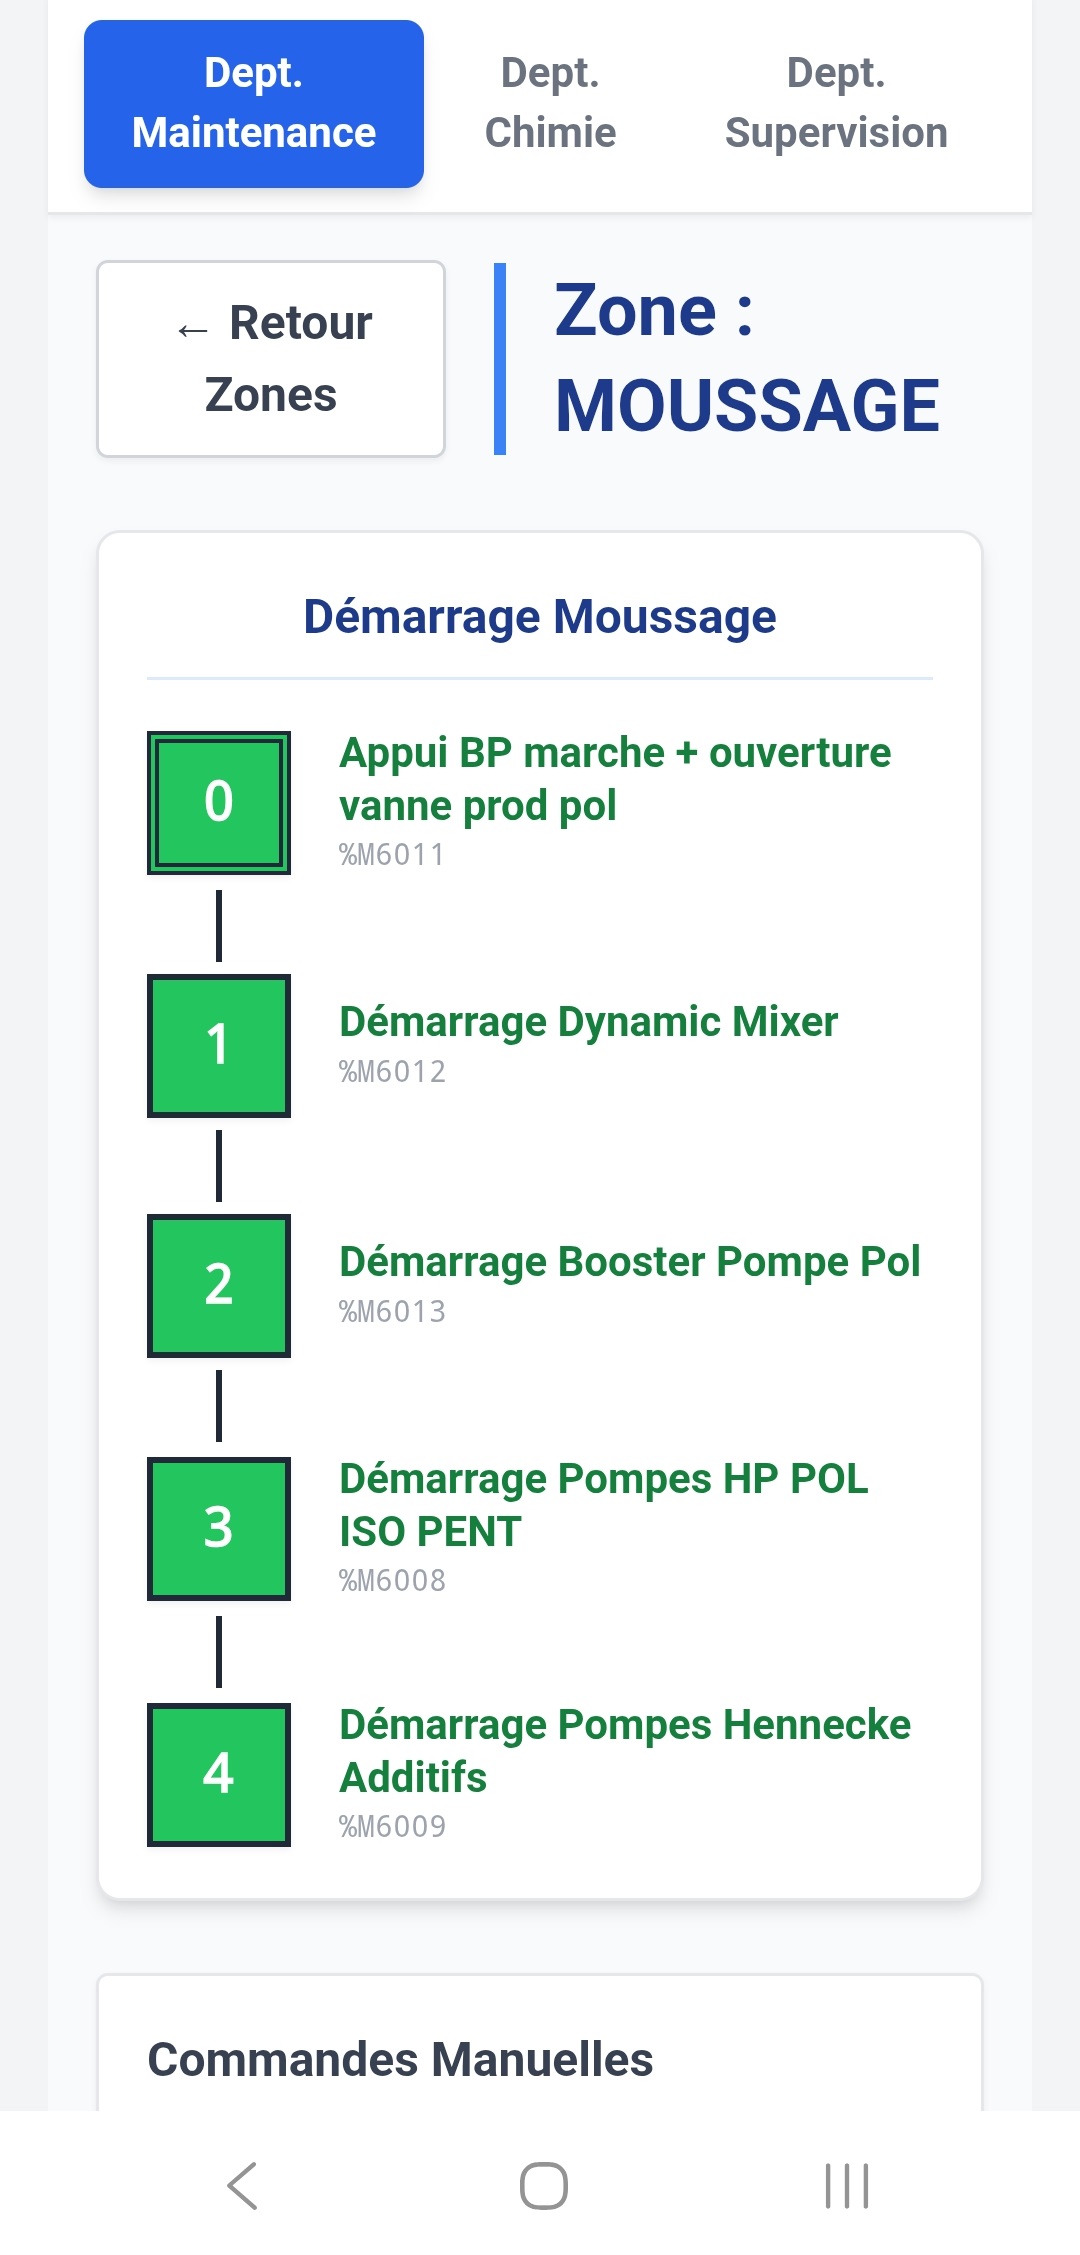
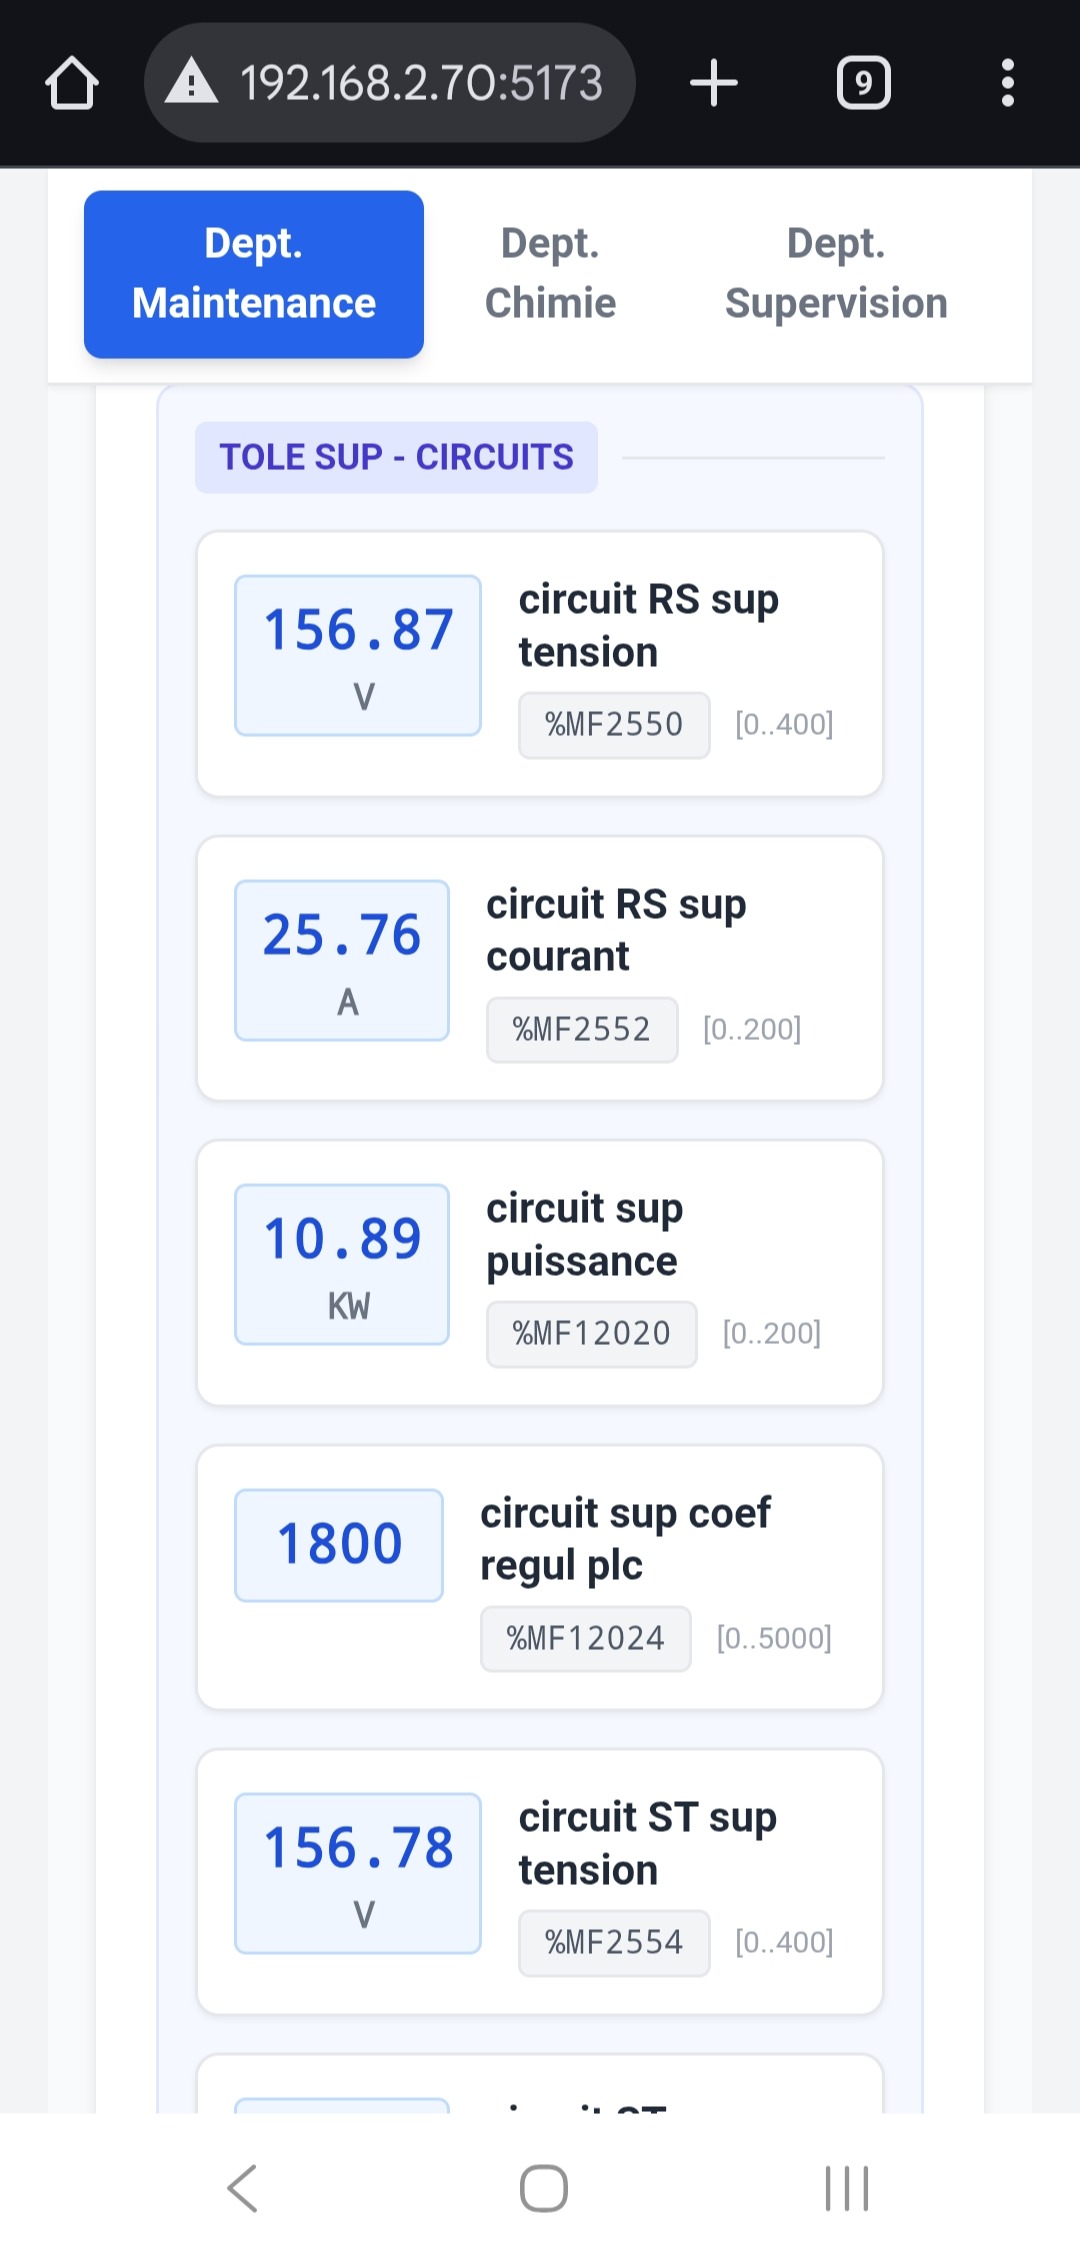
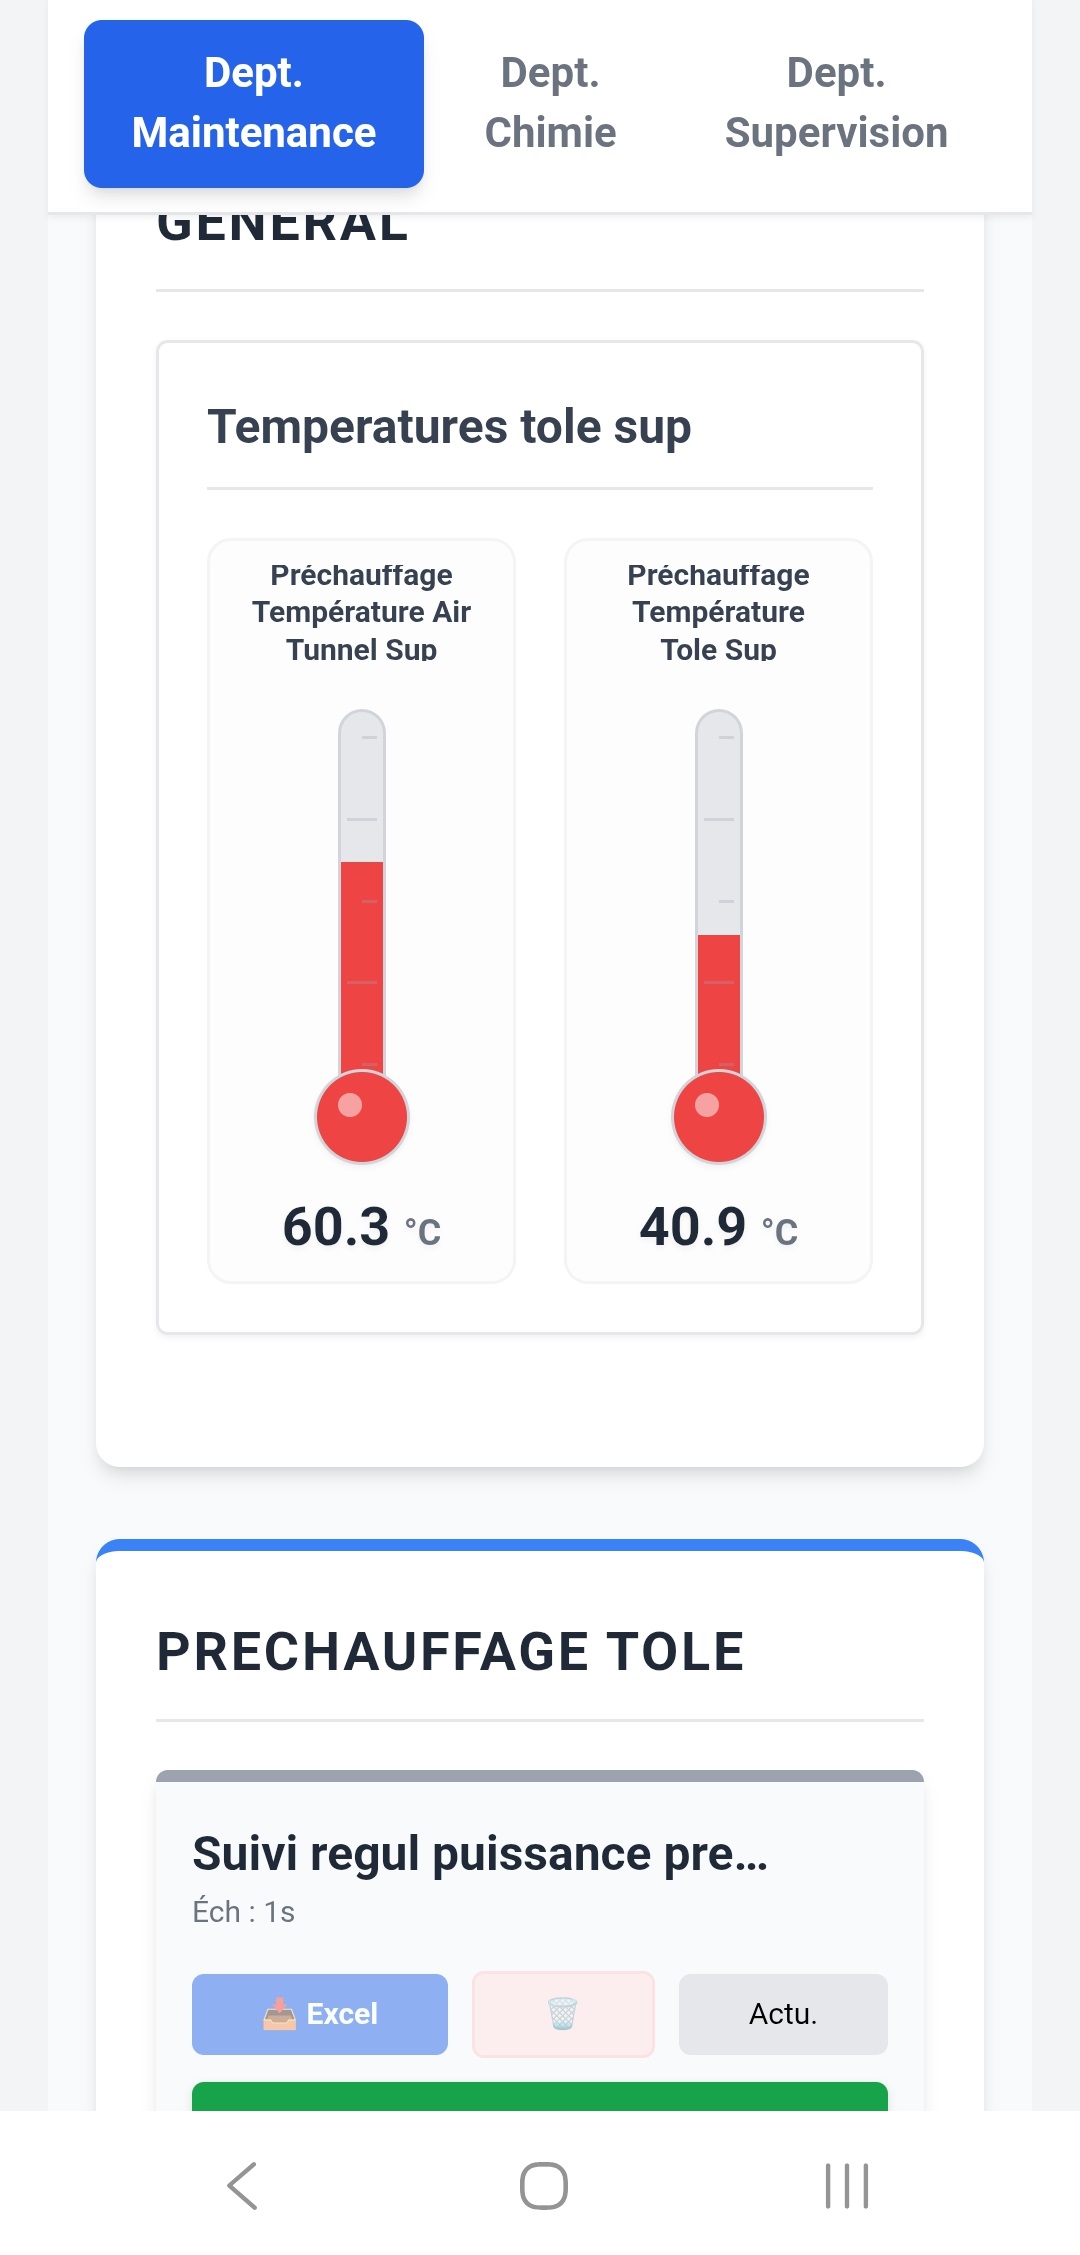
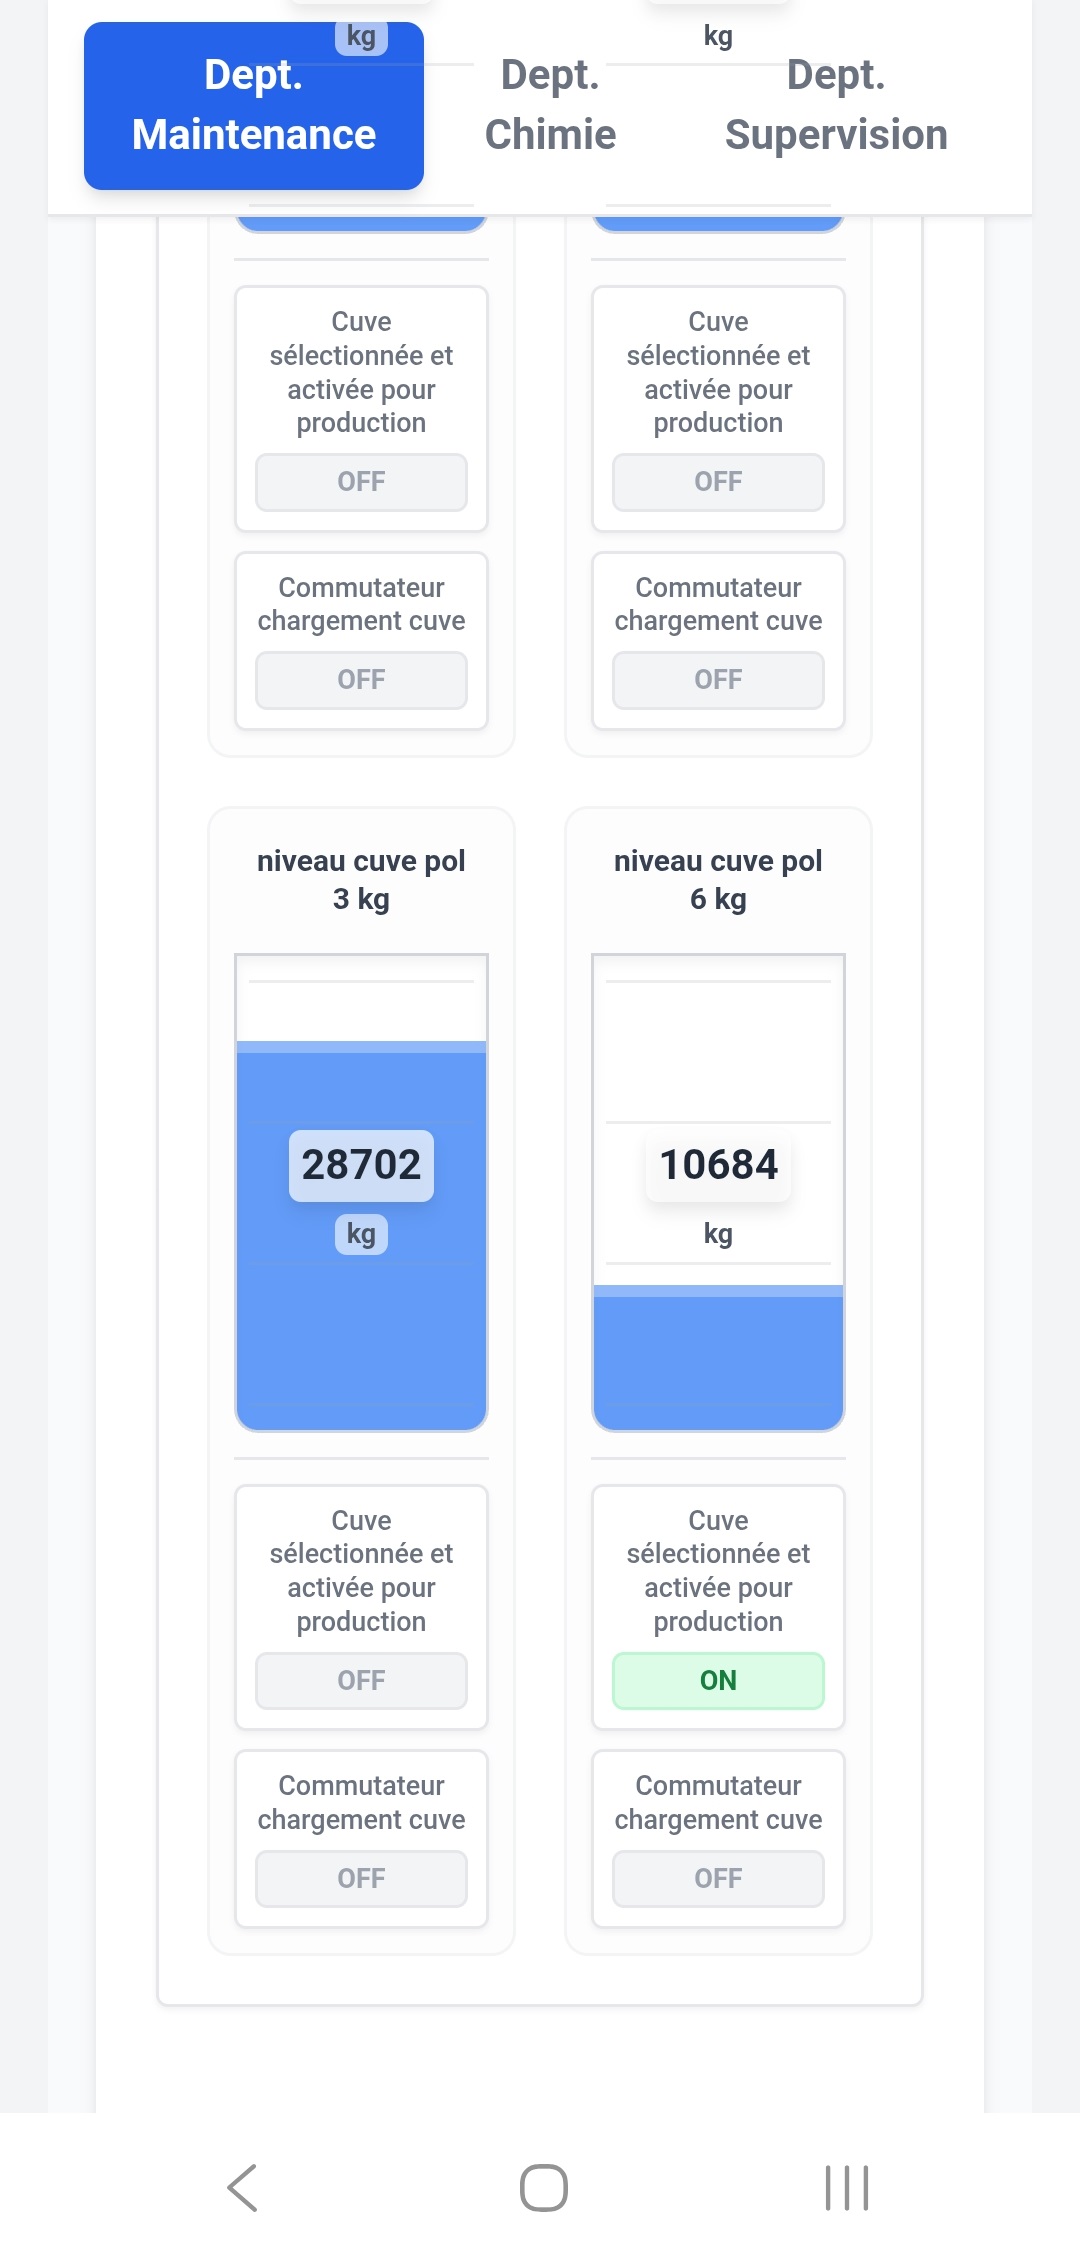
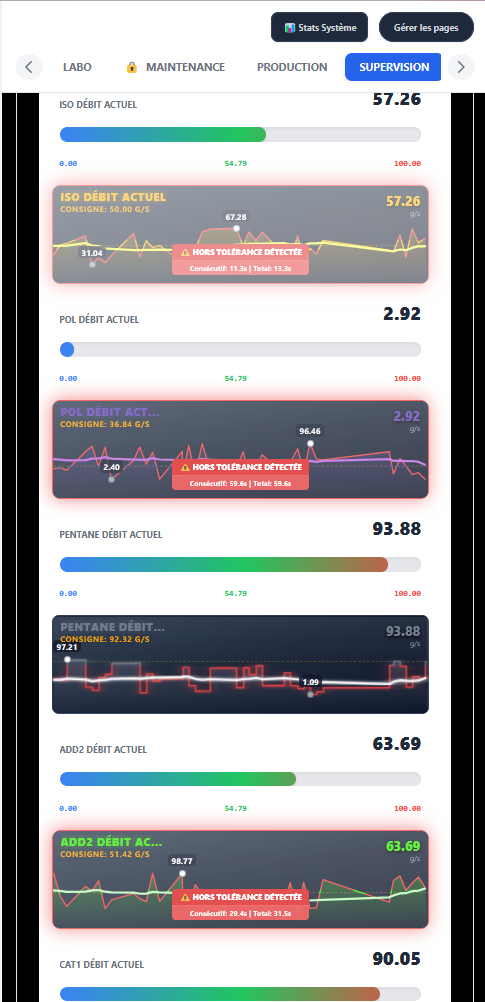
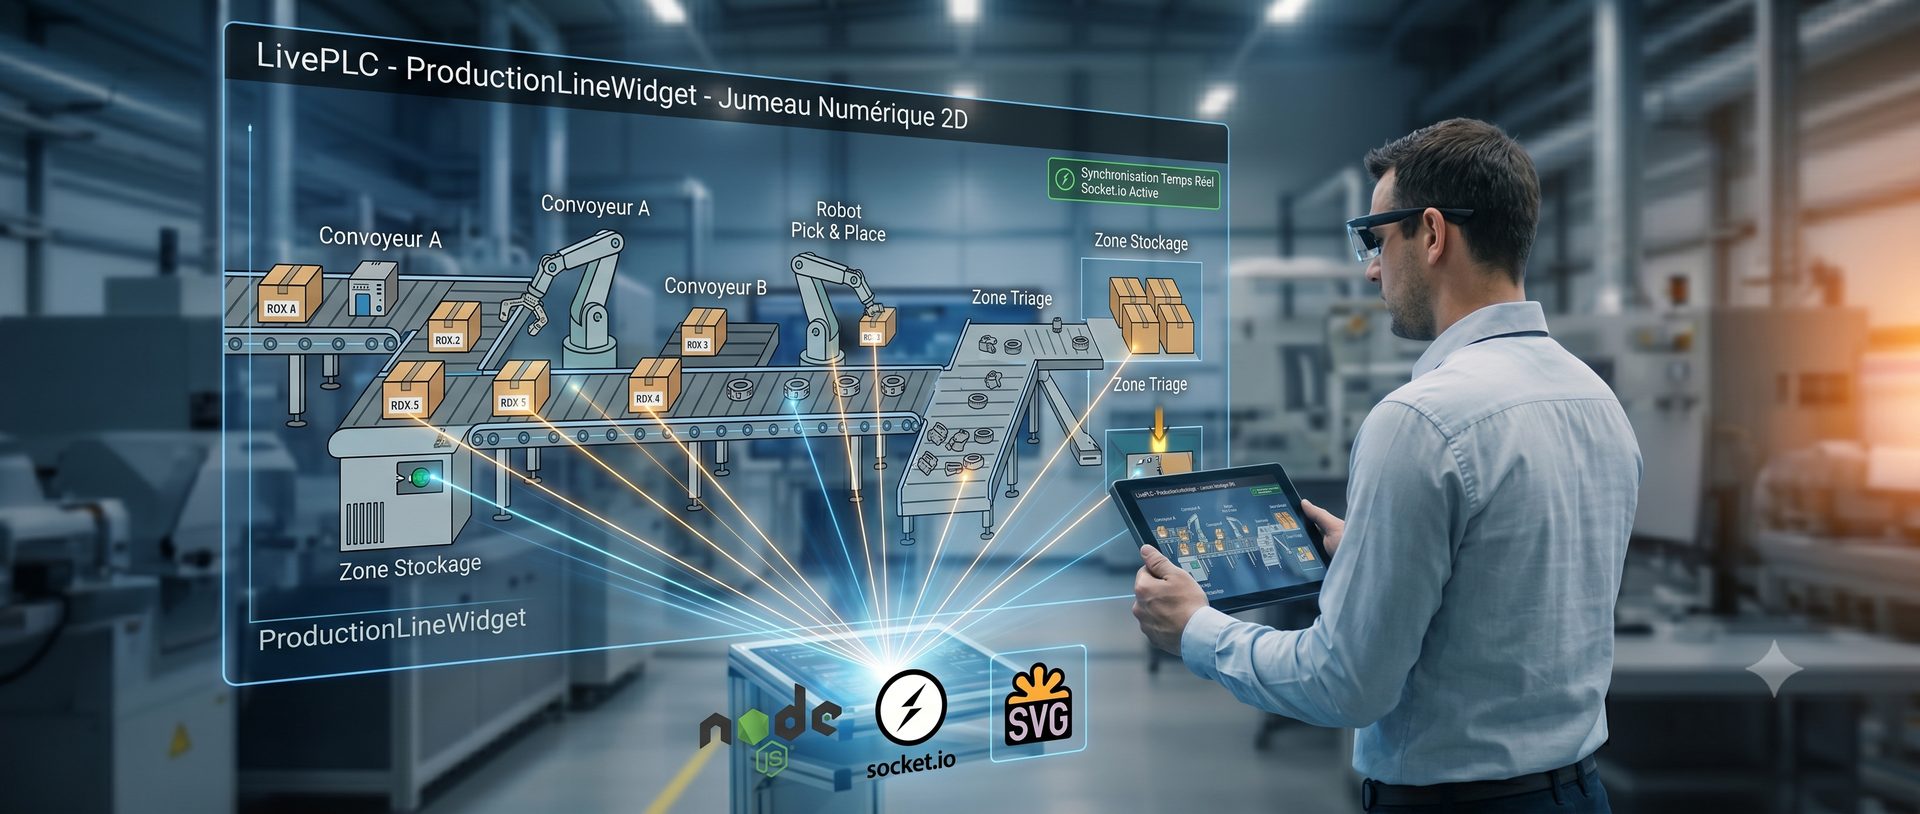
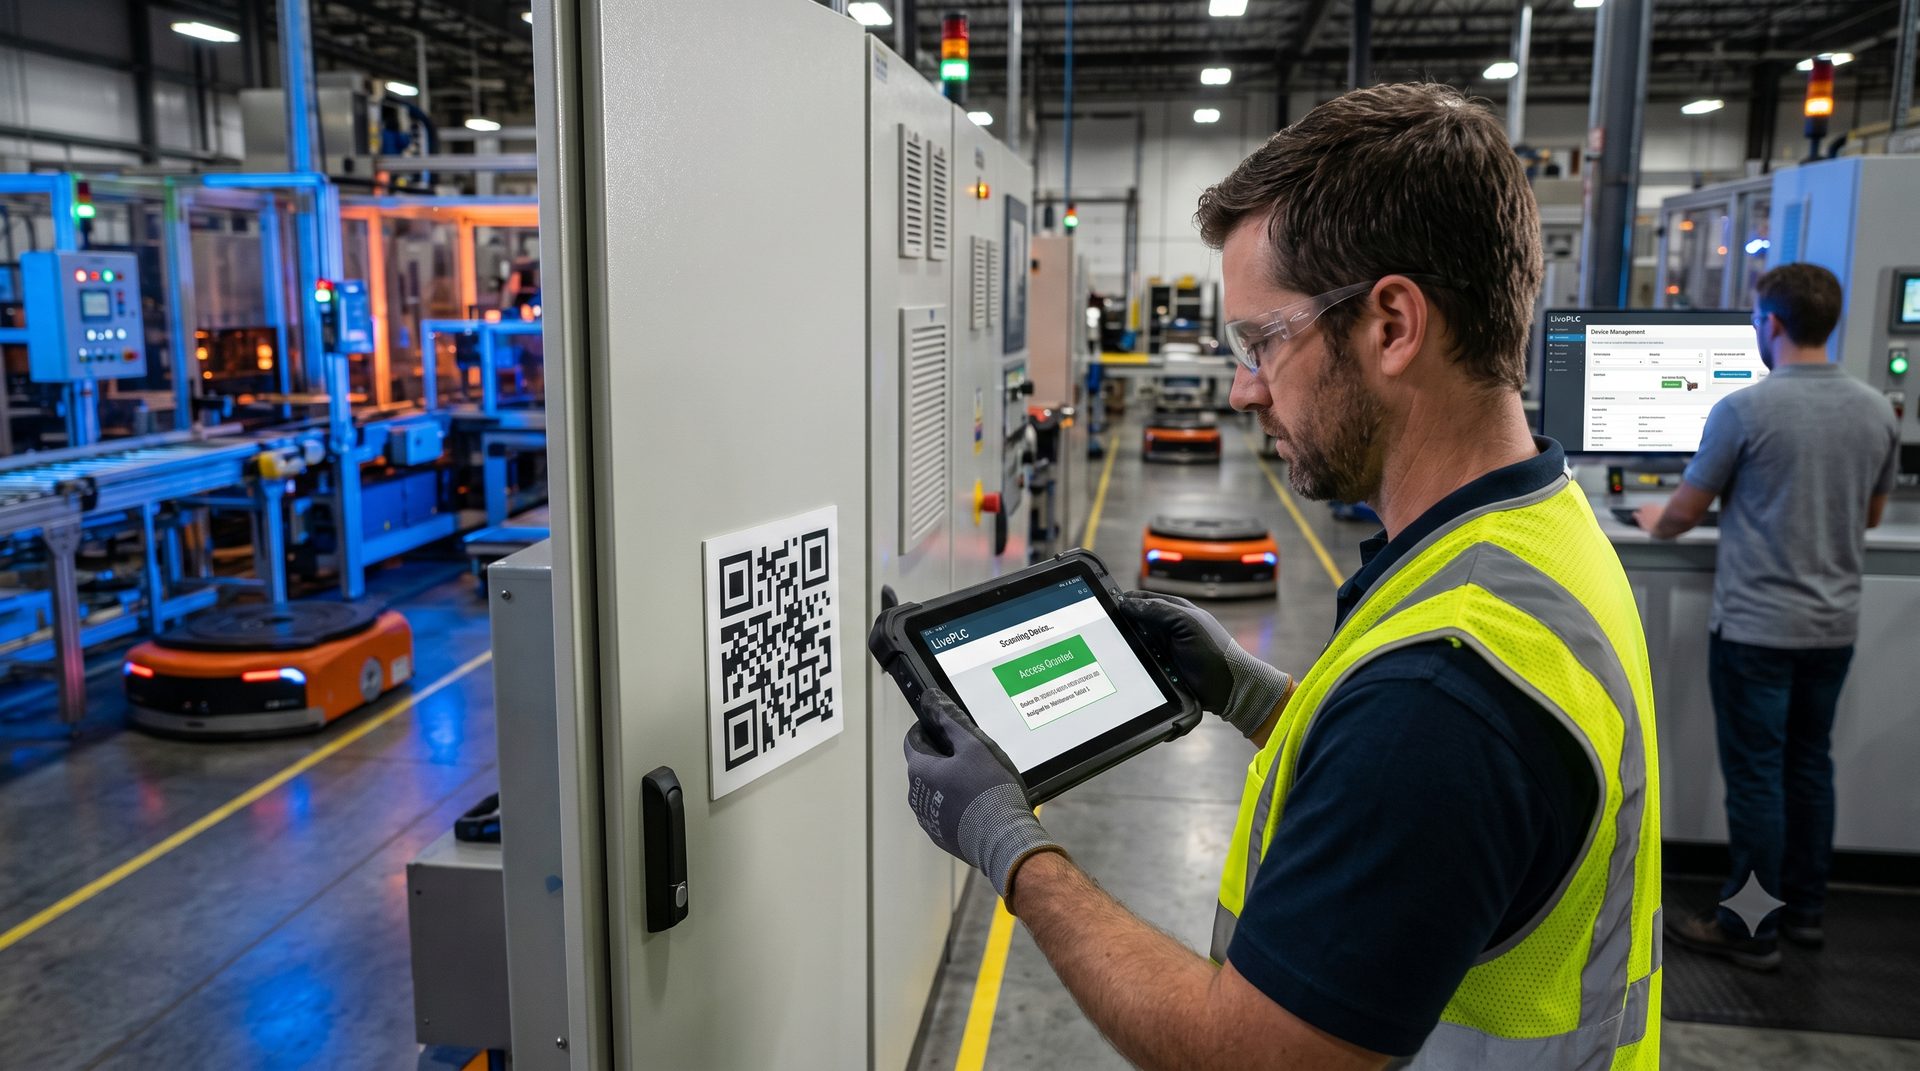
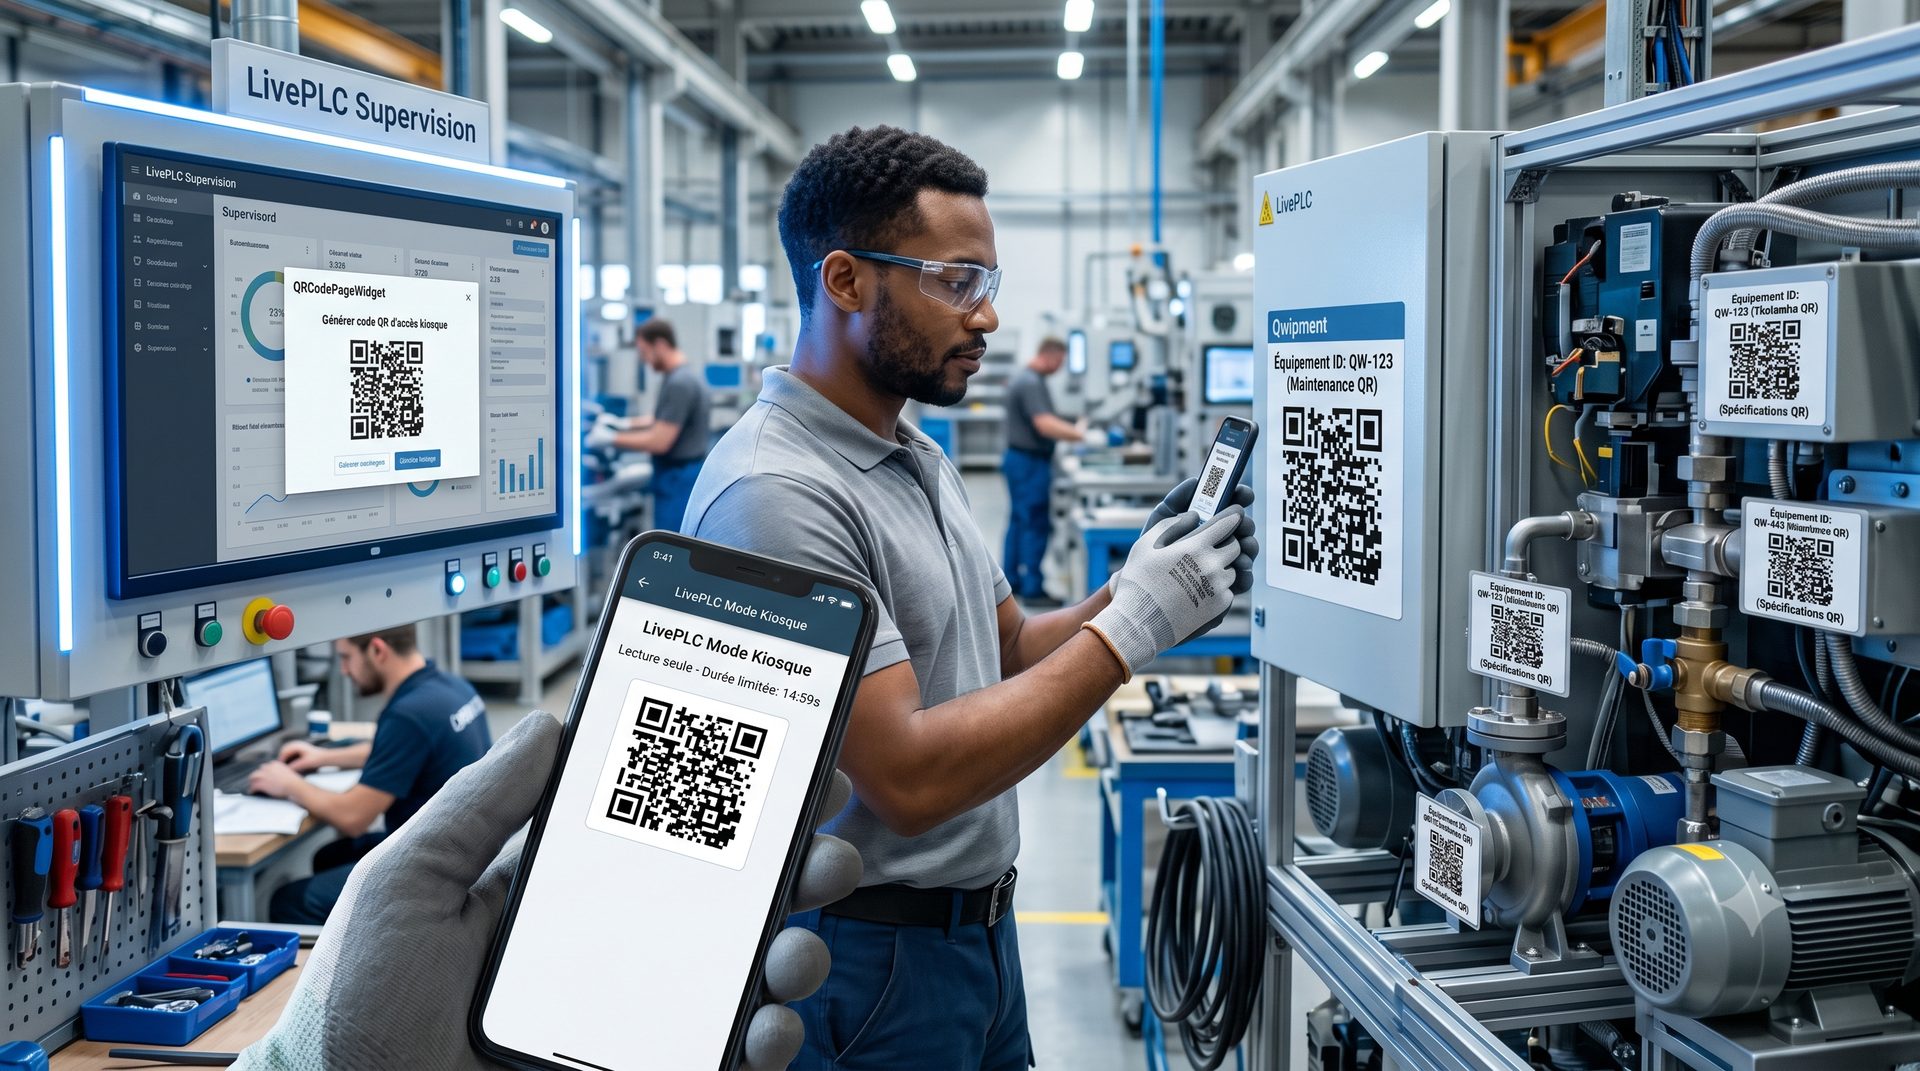
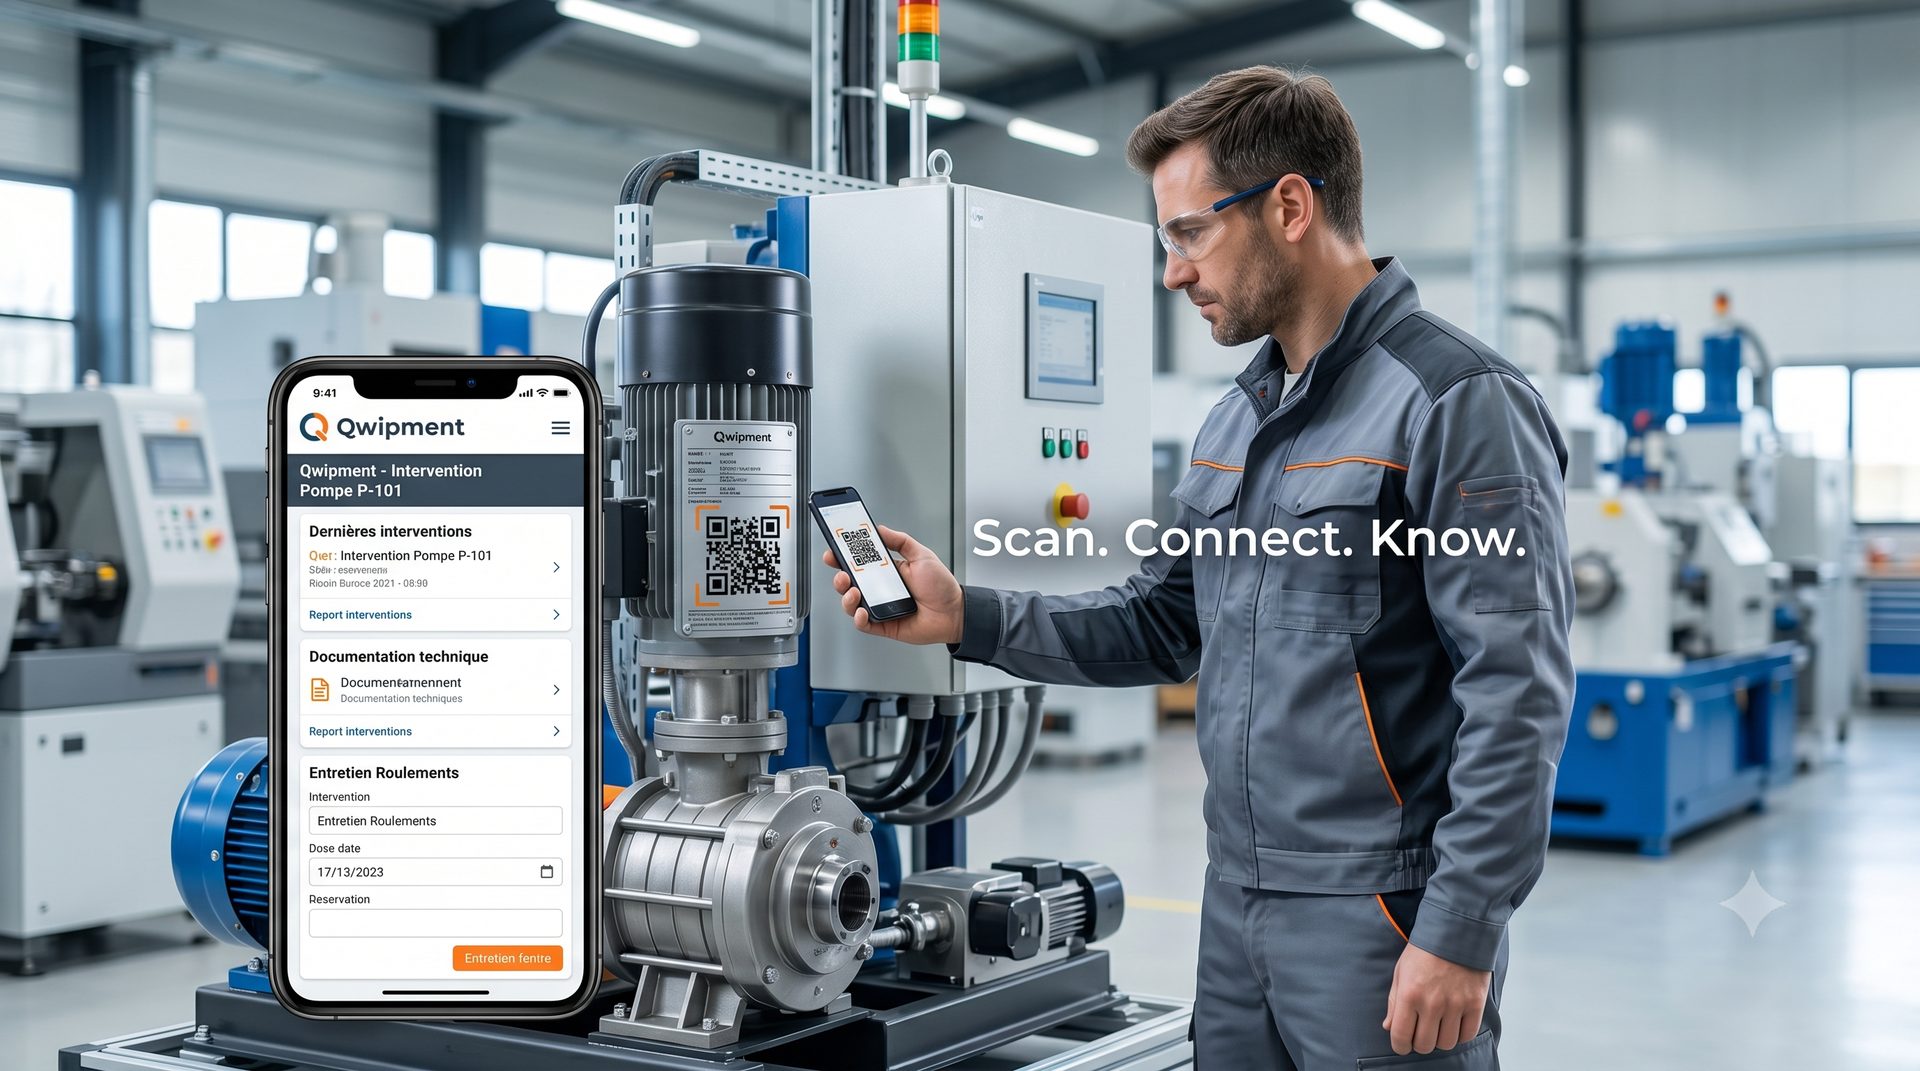
From the start, the core use case wasn't the large supervision screen in a control room. It was the maintenance technician moving along the line. When you're under a conveyor, inside an electrical cabinet, 50 metres from the control screen, being able to pull out your smartphone or tablet to check a sensor value or a drive status is a real time-saver.

Constraints set from the start

  • Zero thick client: everything runs from a standard browser, including on smartphones.
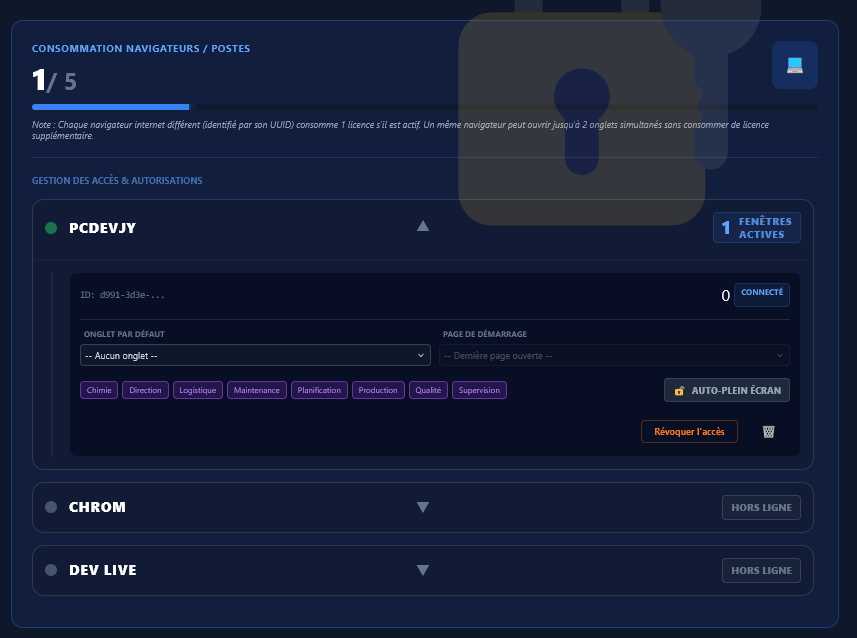
  • Simultaneous multi-user: the Maintenance Manager from their office, the Technician from the shop floor.
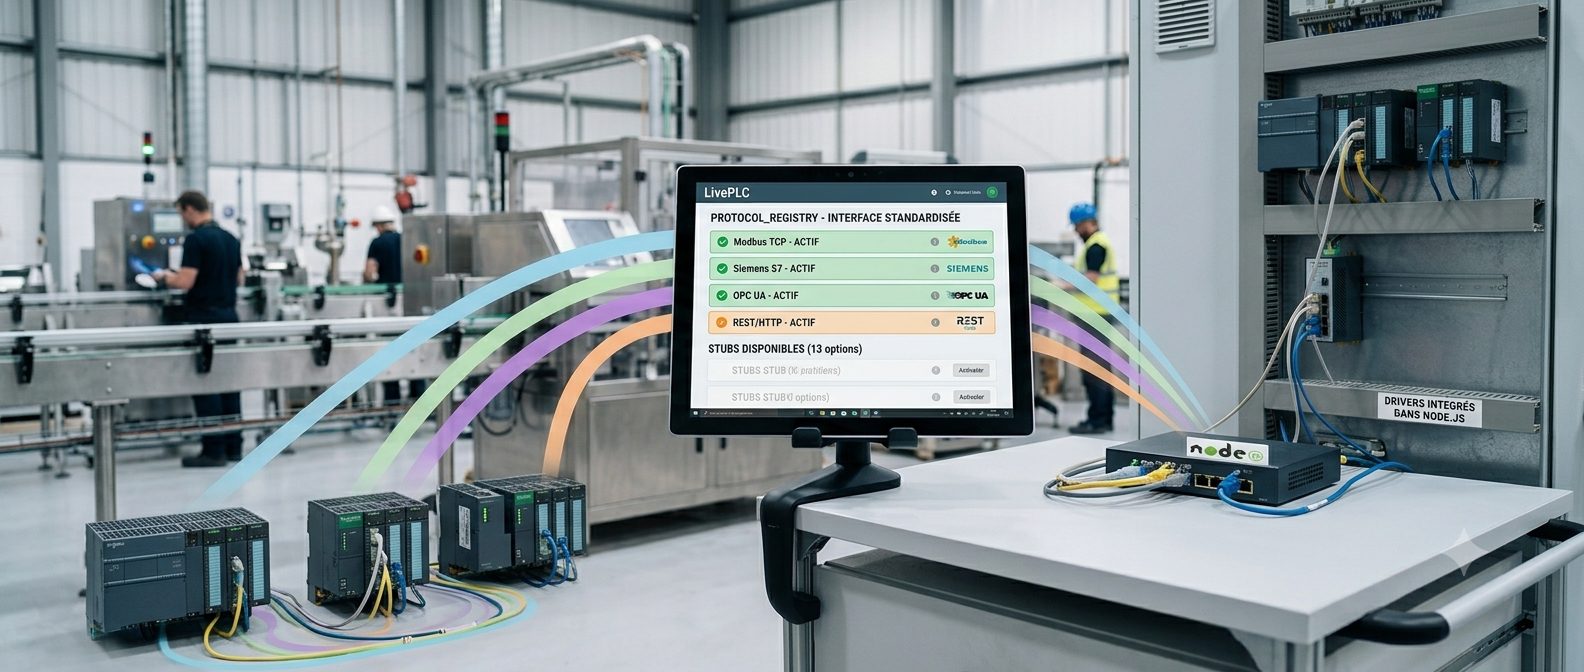
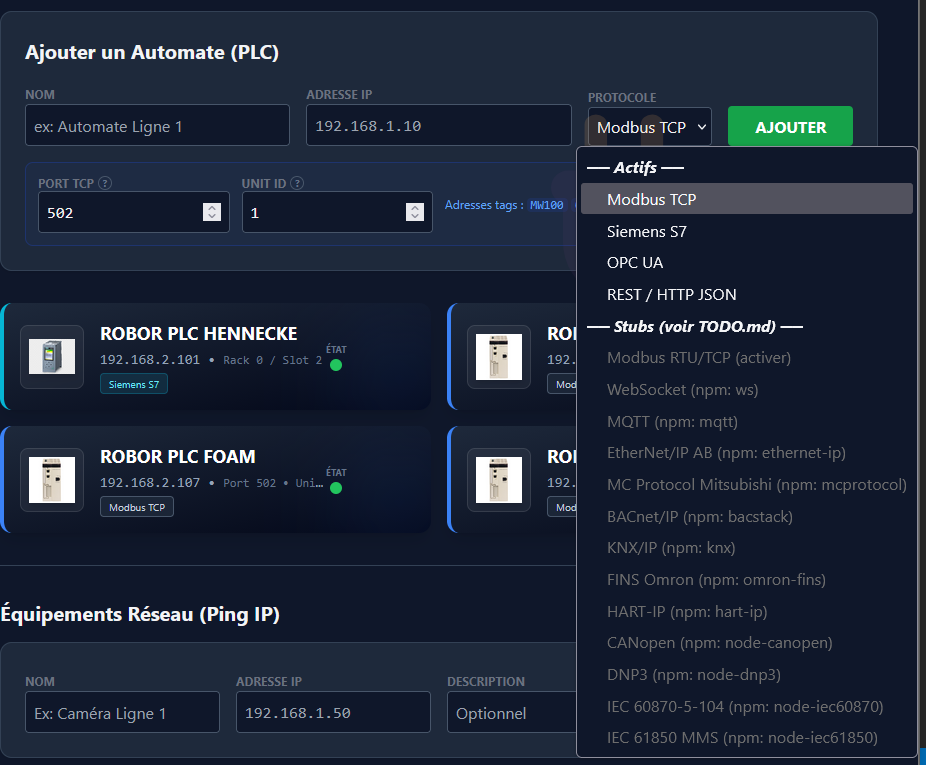
  • Multi-protocol: Modbus TCP, Siemens S7, OPC UA — real PLCs, not just the latest models.
  • Deployable on modest hardware: Raspberry Pi 4, NUC, or shared VM for the backend — a smartphone or any browser for the frontend, and why not for the backend too for lightweight installations.
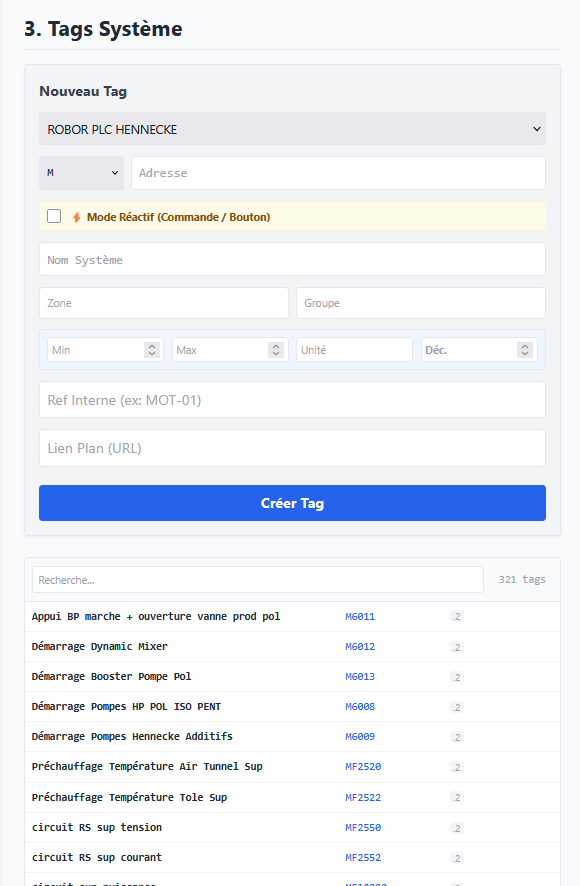
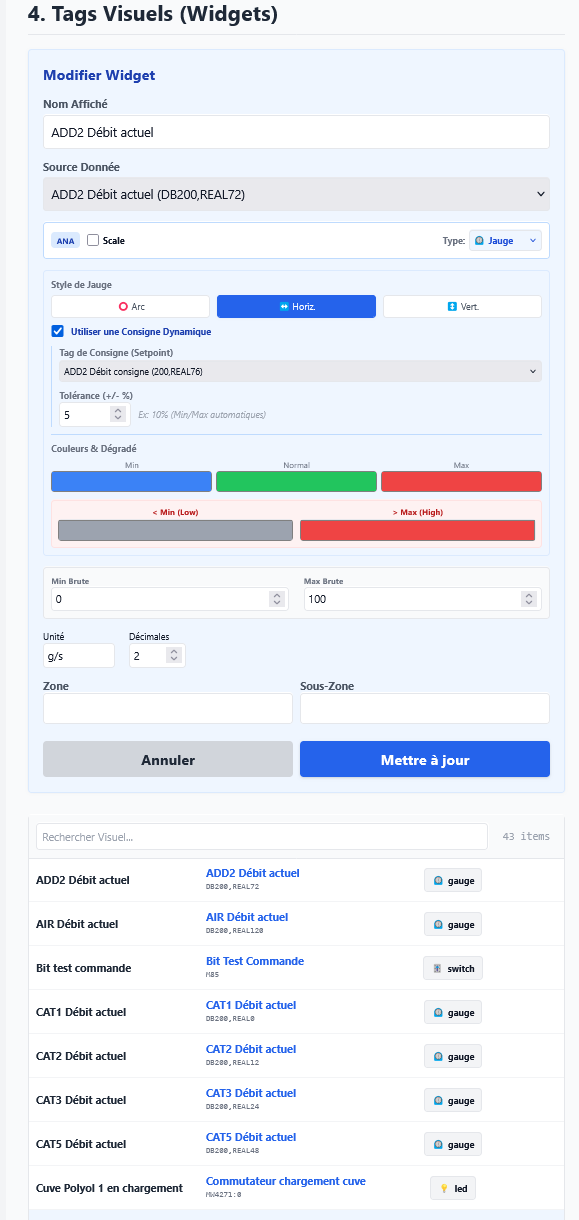
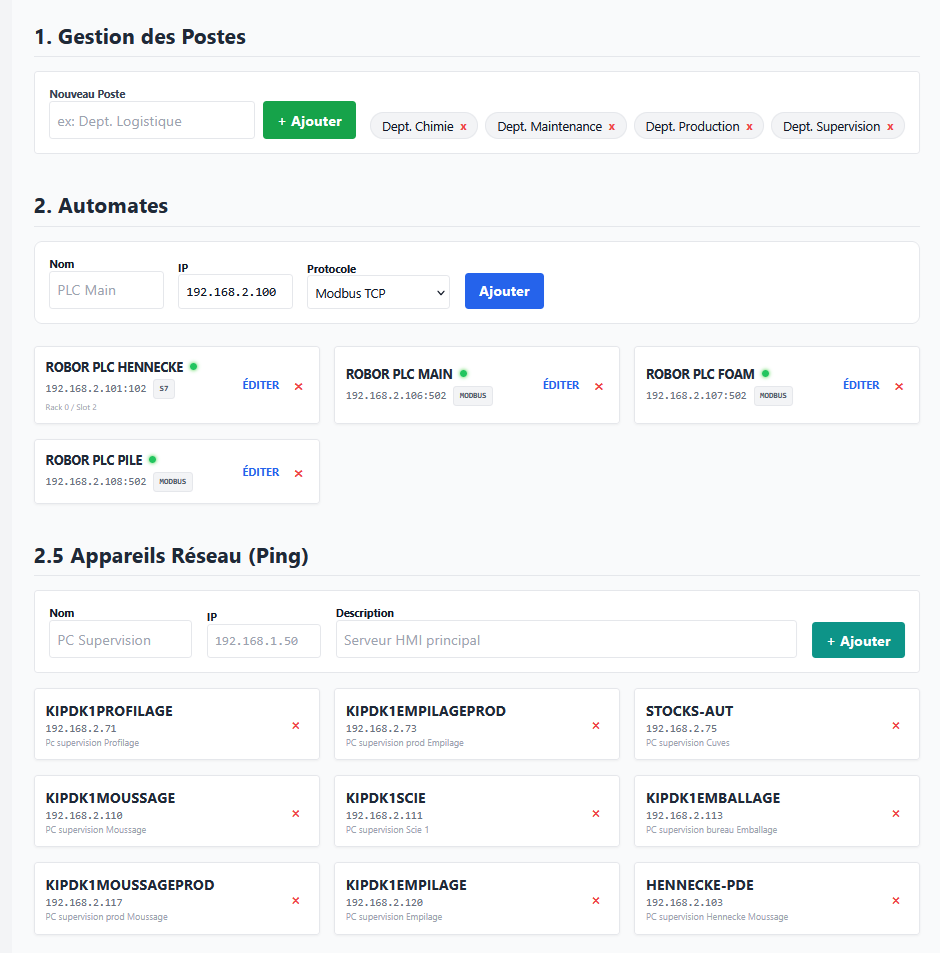
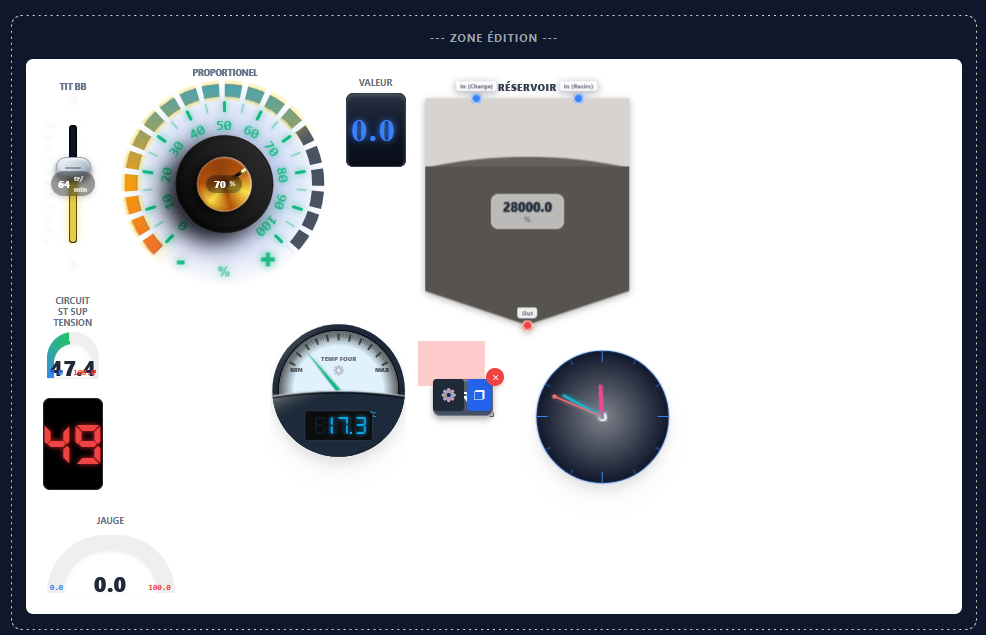
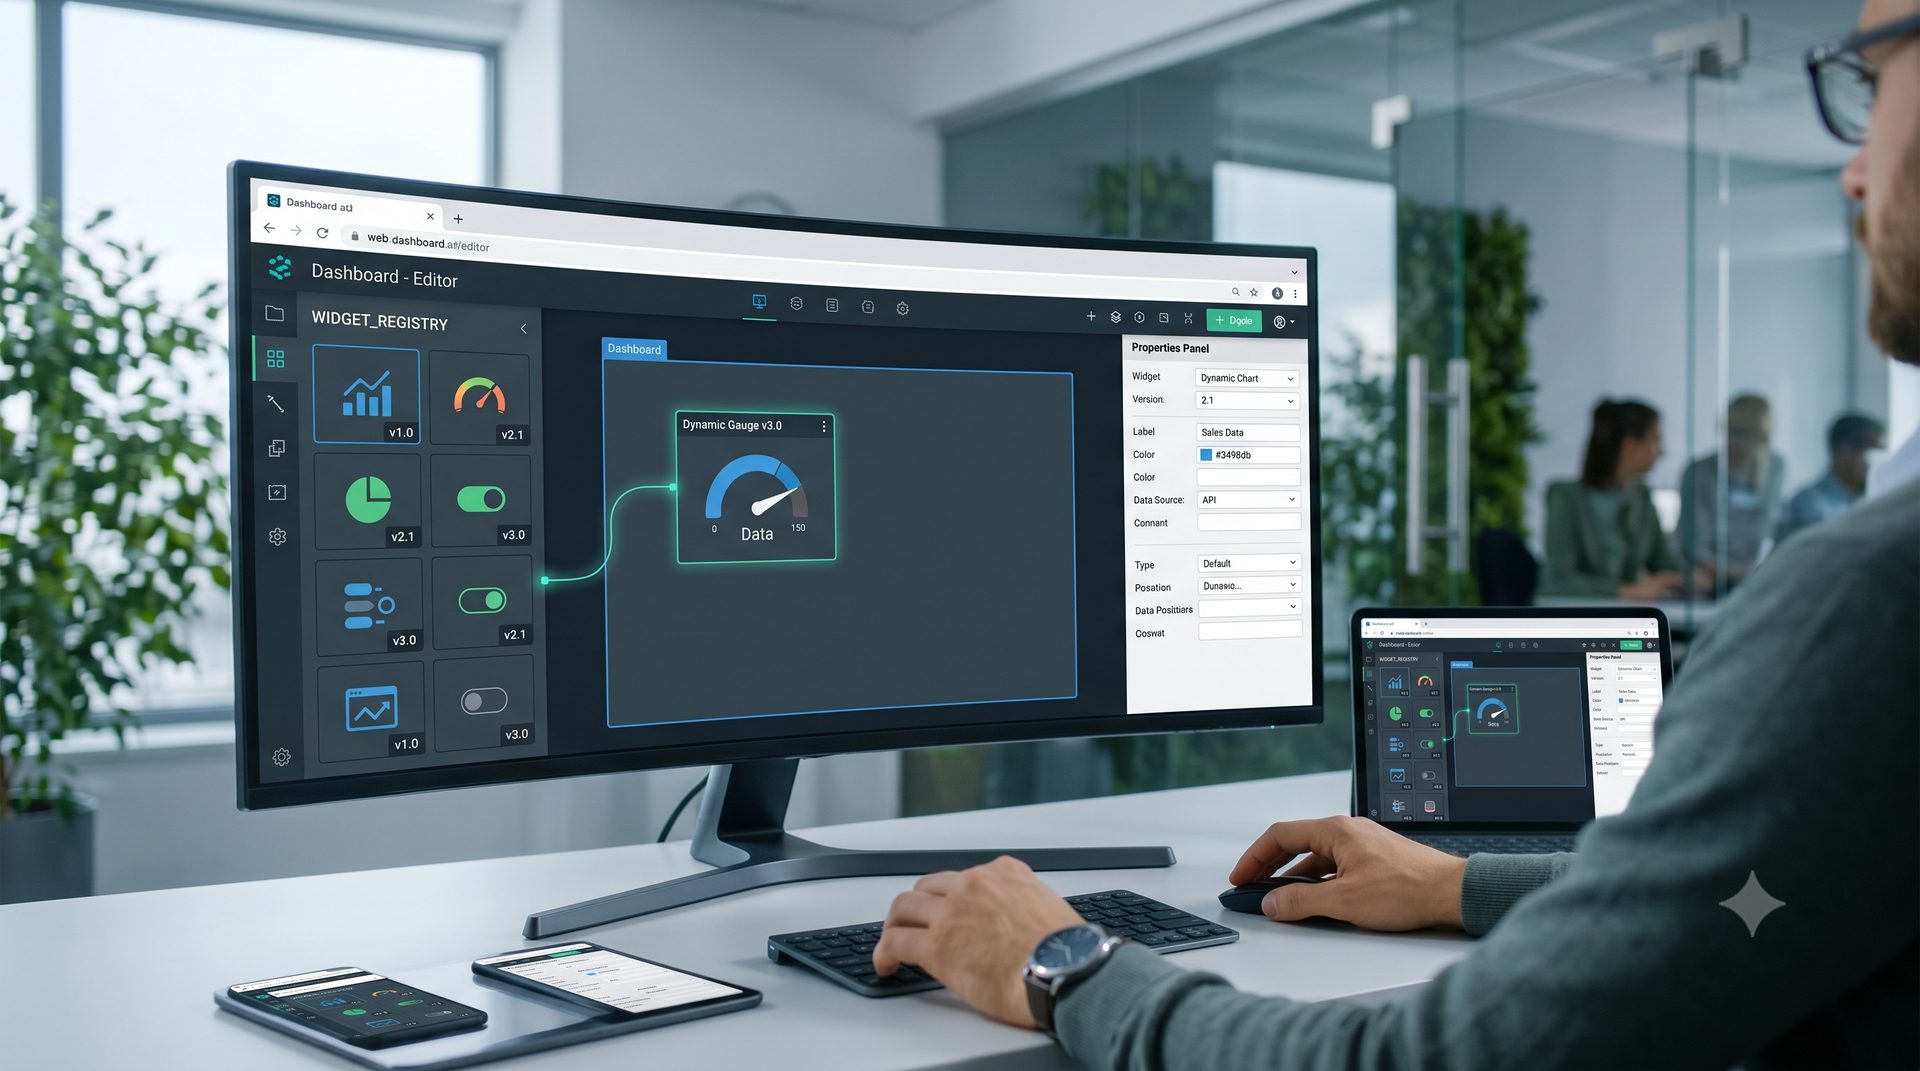
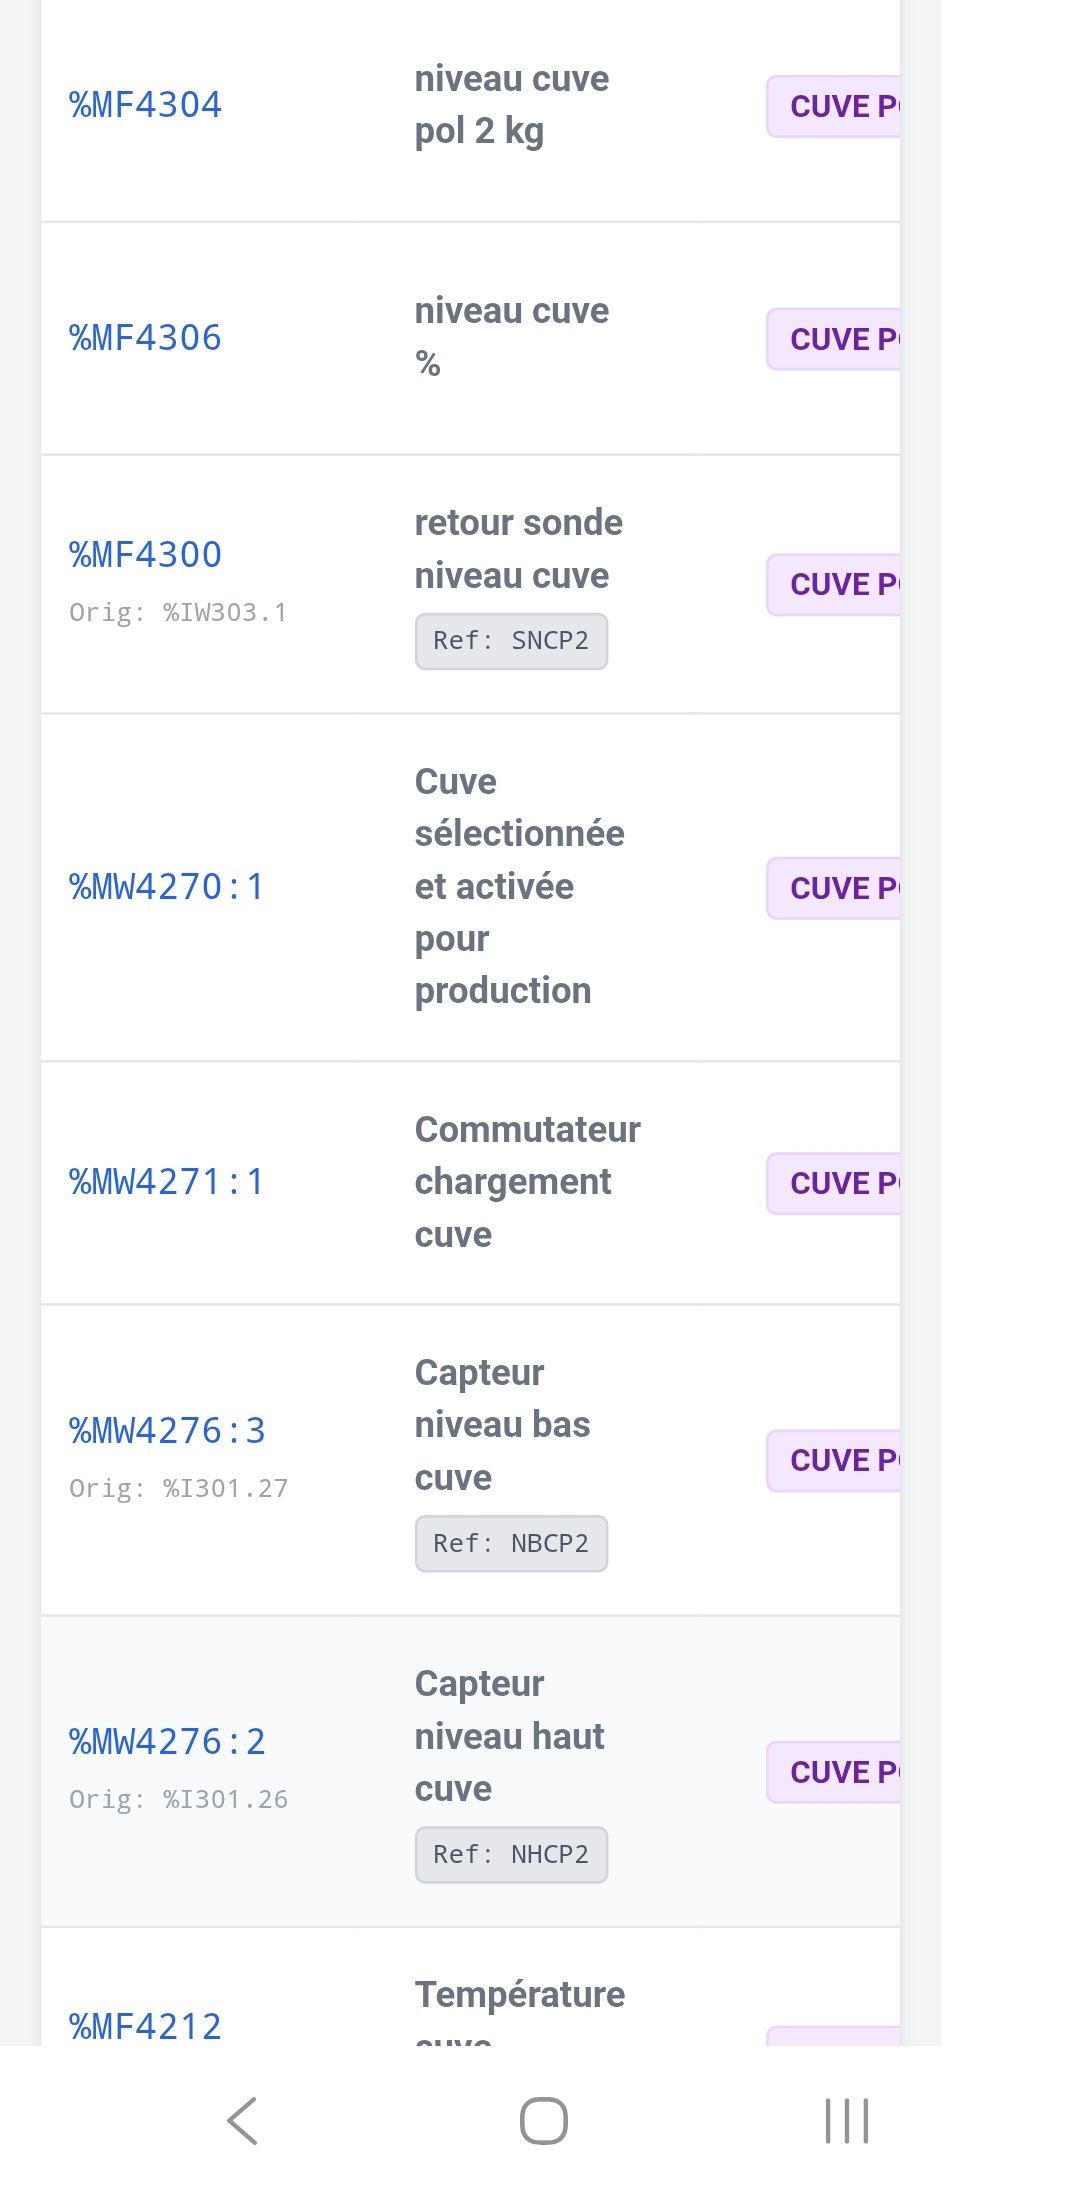
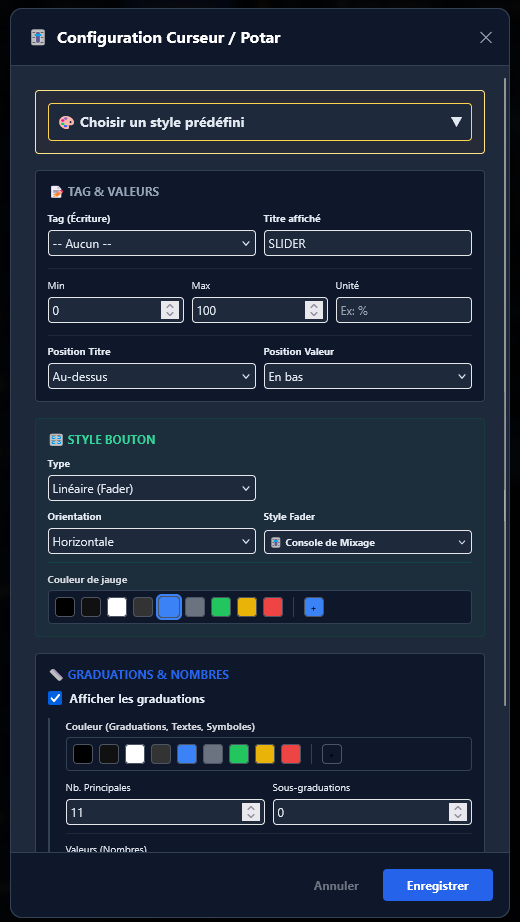
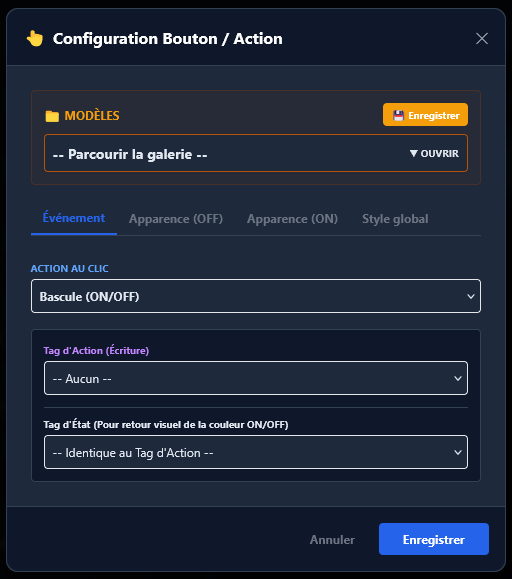
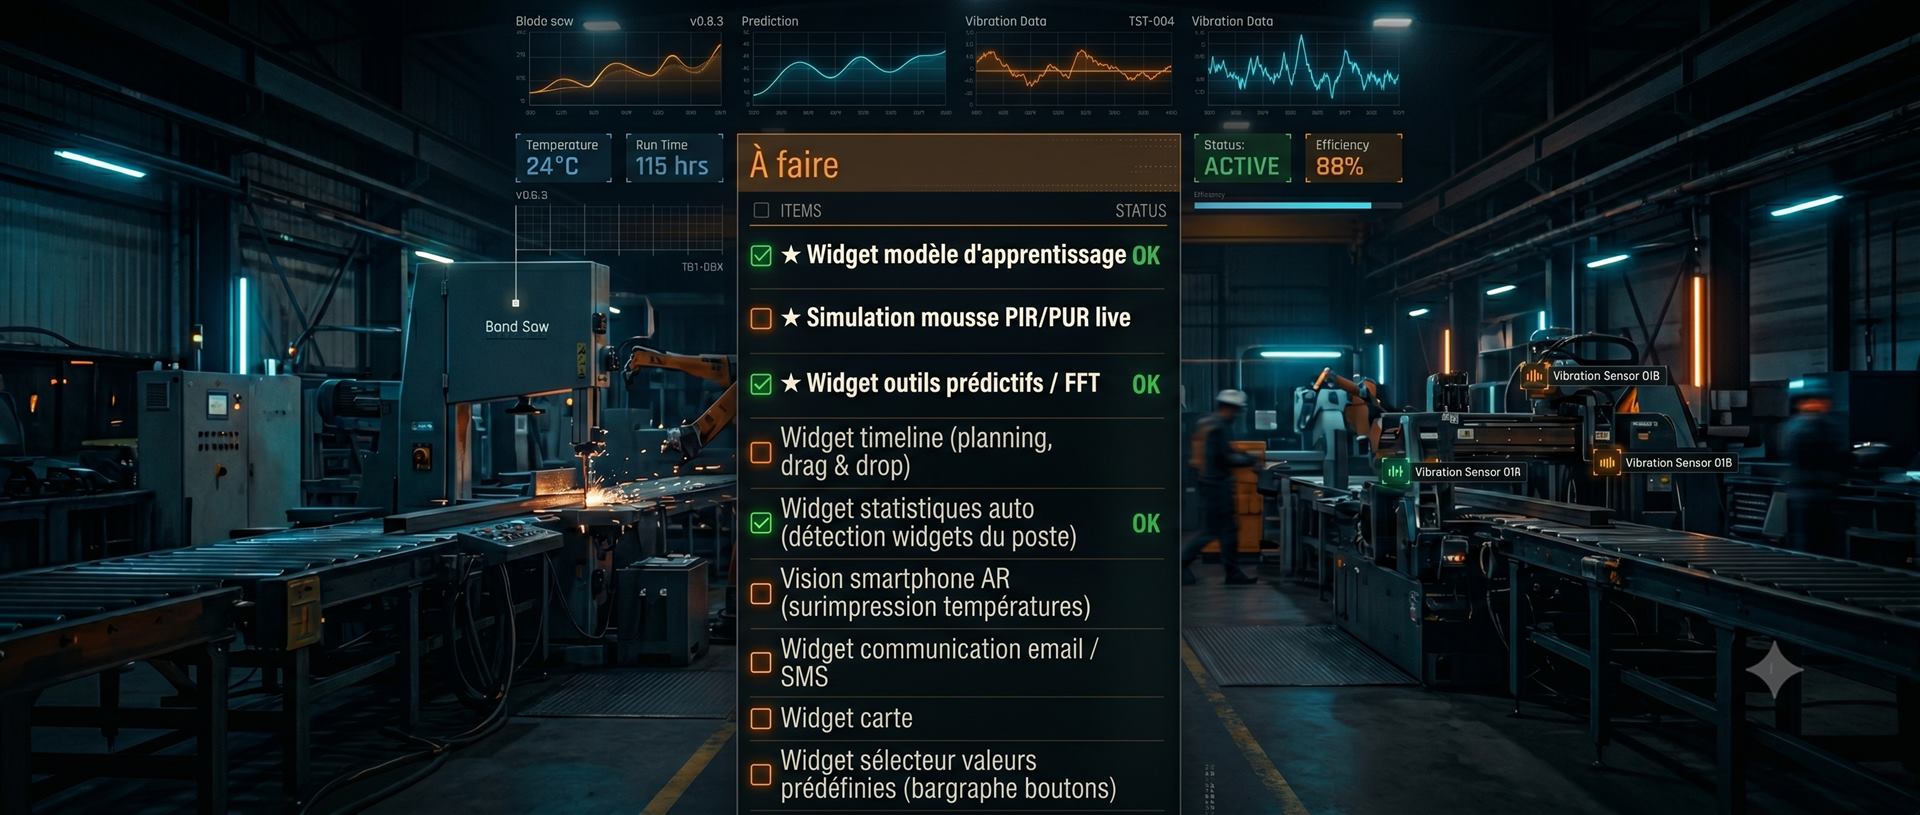
  • Quick onboarding: make page creation and modification as simple as possible, quickly generate and visualise PLC values.
  • Fast installation: a server centralising all data and a client workstation with nothing more than a web browser. When troubleshooting a client station, nothing is faster.

Choosing the tech stack

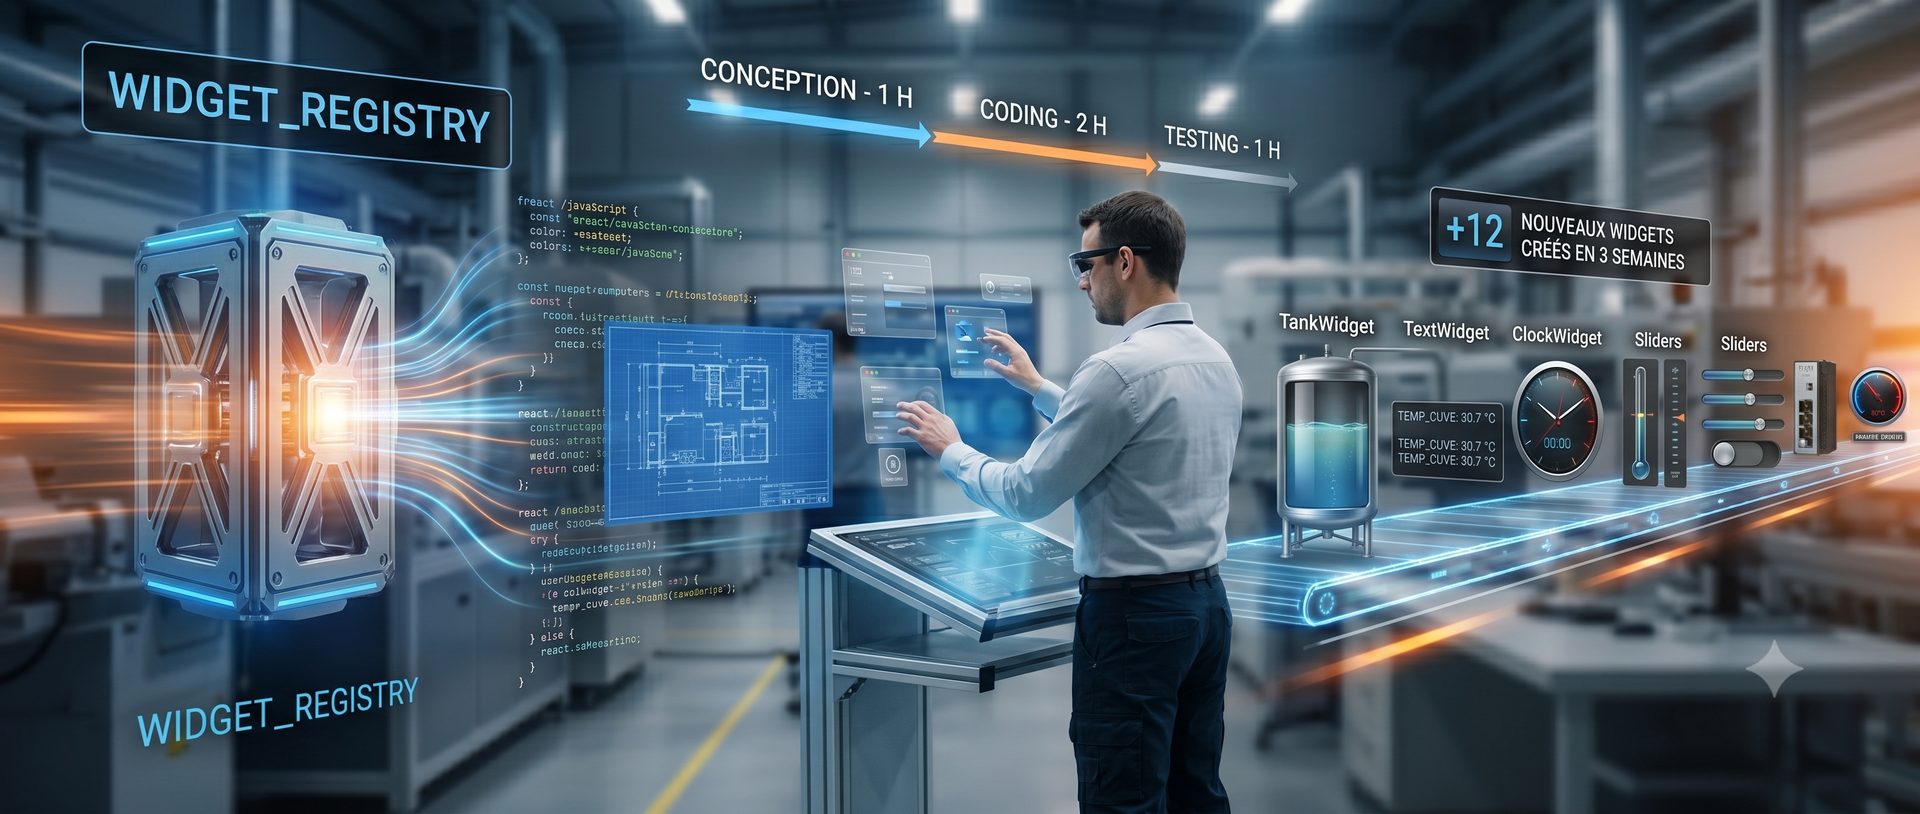
Node.js + Express for the backend — the npm ecosystem has libraries for Modbus (jsmodbus), S7 (nodes7), OPC UA (node-opcua), and Socket.io is right at home for real-time.

React 19 + Vite + TailwindCSS for the frontend. React for state management and the component system. TailwindCSS because I didn't want to waste time on CSS for dozens of different widgets. SQLite embedded for day-to-day persistence — the goal being primarily visualisation and control, not archiving — and later InfluxDB for data history if the need arises.

OVERALL TECHNICAL ARCHITECTURE BROWSER React 19 + Vite TailwindCSS Visualise tags graphically Dynamic dashboard Chrome · Firefox · Mobile Socket.io / HTTP NODE.JS BACKEND Express + Socket.io SQLite · 22 tables 80+ routes HTTP · JWT Polling REACTIVE · FAST · SLOW 3 protocol drivers RSA licence · page management alarms · users · devices Raspberry Pi 4 · NUC · VM MODBUS TCP Modbus PLCs Port 502 · MW · Coils · Input Regs SIEMENS S7 CPU S7-300 / 400 / 1200 Port 102 · DB · M · Q · I OPC UA OPC UA Servers Port 4840 · Subscribe · Nodes All clients receive data simultaneously · Configurable polling 100 ms – 10 s · Embedded SQLite
LivePLC overall technical architecture

The Settings page, tag table and the first Visual Tags

The foundations are in place: the Node.js backend is running, Socket.io is broadcasting in real time, and two protocols are already connected — Modbus TCP (port 502) and Siemens S7 (ISO-TSAP, port 102). Before being able to display anything, the data needs to be named: every PLC register to be read or written must be declared with its address, protocol, type and polling speed.

The Settings page, a protected cockpit

I start with the Settings page, which must be protected by a PIN code. It centralises all system configuration in sections that let you address the elements to read/write, where and how to do it: PLCs, network devices, system tags. Then, shortly after, the rest falls into place: visual tags to define how tags are displayed on the workstation, trends to track value evolution, recipes that let me add batch functions to the tag creation module, Grafcets and finally alarms. All the infrastructure is configured here before building the supervision pages.

The system tag table

Each tag declares its PLC, its register type (MW, MF, MD, M, I, Q, DB for S7…), its address, its display label and its polling cycle. A "Reactive Mode" checkbox forces the tag into the 150 ms cycle — useful for buttons and direct outputs. A Test Read button lets you immediately verify the value read from the PLC within the form.

Settings v1, System Tags section, list

Visual Tags, the first layer of graphical representation

A Visual Tag is a presentation layer placed on top of a system tag: you choose a graphical type for it, and it displays the value in real time. The detection logic is automatic based on the register type:

📊
Analogue
Word registers (MW, MF, MD). Available types: Text, Gauge (half-circle), Bar, Thermometer. With configurable scaling (raw → physical unit).
🔘
Digital (discrete)
Bits or bit extraction from a word (M, Q, MW:0…). Available types: LED, Text, Button, Switch. With configurable OFF/ON labels and colours.

A visual tag is configured in Settings — name, source tag, graphical type, unit, decimals, colours. Once created, it appears in the page editor sidebar of the dashboard, ready to be drag-and-dropped onto any supervision page.

Settings v1, Visual Tags section, creation form
LivePLC v1, runtime, first result
📝
Natural evolution towards widgets Visual Tags in Settings was a logical first step — but it created friction: you had to go to Settings, create the visual tag, then go back to the dashboard to use it. Once the dashboard edit mode grew richer, the question answered itself: why not configure the graphical representation directly when dropping it onto the page? Visual tags then gave way to autonomous, on-the-fly configurable widget components, and Settings lost this section in favour of a much smoother experience.

Real-time data architecture

The core of the runtime rests on a cyclic polling loop on the backend side, coupled with Socket.io to push values to all connected clients simultaneously.

🔴
REACTIVE, 150 ms
Tags marked is_command = 1. Buttons, outputs, direct commands. Responsiveness is key.
🟢
FAST, 500 ms
Standard process tags: temperatures, pressures, flow rates. The majority of measurements.
🔵
SLOW, 1 000 ms
Tags on inactive tabs, recipes, rarely-consulted data.

Page management and routing

LivePLC is an SPA (Single Page Application). Supervision pages are stored in the database — each page has an identifier, an associated department, and a list of widgets with their positions and configurations. The frontend loads the configuration via the API, instantiates the widgets, and starts consuming data via Socket.io.

Departments, services and authorised devices

Fairly early on, I realised that a factory cannot have a single supervision screen shared by everyone. A notion of department was needed — a logical zone grouping pages, users and permissions.

Each department can be protected by a PIN code. Devices (tablets, operator PCs) are registered with a unique UUID and assigned a department and a home page. When a tablet is recognised, it goes directly to its context.

Runtime interface on PC, supervision page with real-time widgets
Same page in portable mode, single-column layout on smartphone

Alarms integrated into the runtime

The alarm engine continuously evaluates conditions on tags (thresholds, rising/falling edges, logical combinations). When an alarm triggers, it appears in the alarm bar at the top with its criticality level and a configurable sound. Acknowledgements are recorded in a journal.

Alarm trigger and acknowledgement, alarm bar, history log
💡
Implementation detail Socket.io broadcasts a realtimeData { [tag_id]: value } object to all clients. Each widget subscribes only to the IDs it cares about via a memoised React selector — no global re-render on every update.

LivePLC's dashboard, a pocket-sized real-time supervision tool

The first prototypes of LivePLC were designed entirely for vertical reading on a small screen. Pages displayed as a list of widgets stacked on top of each other, scrolling vertically — exactly like a mobile web page. Simple, effective, and accessible from any phone on the factory wifi network.

Prototype v1,  Zone Moussage sur smartphone, janvier 2026
Prototype v1, Zone Moussage supervision (startup sequence), January 2026
LivePLC v1 in production, upper sheet circuits, network URL visible
Upper sheet, electrical circuits in real time. URL 192.168.2.70:5173 visible: live in production, on the factory network.

The runtime is the main usage mode of LivePLC: the screen the operator sees on the shop floor. It displays sensor values, machine states, and active alarms. Unlike edit mode, the runtime is in controlled read-write mode — you can send commands to the PLCs, but you cannot modify the layout.

LivePLC v1, runtime
LivePLC v1, runtime
📝
Update — One month later, first field comparison

One month after the first lines of code, LivePLC is being tested on the factory network.

It was time to put them side by side: the proprietary supervision system that had been in place for years, and my version running on a smartphone.

The video is clickable — click on it!
Proprietary supervision software, compiled, Windows-only
Proprietary supervision, compiled, Windows-only, impossible to customise
LivePLC, an Android browser is all you need. Same page, same data, from a smartphone on the shop floor

The portable-first layout: from a good idea to an obvious limitation

From the very first weeks, LivePLC's layout was based entirely on a 12-column vertical grid system inspired by Bootstrap. The idea was simple and consistent with the original project: pages are edited on a PC but designed to be read on a smartphone. So you compose vertically, and everything adapts automatically. This model held for the first few weeks — until the limitations on PC screens made themselves felt.

Goal of the day: design a layout adapted to the technician's smartphone, comfortably editable from a PC

The principle: React-Grid-Layout on 12 columns

I used React-Grid-Layout (RGL) — a grid drag-and-drop library. The editing surface is divided into 12 columns. Each widget occupies a width expressed in number of columns (w) and a height in grid units (h). Position is defined by x (starting column) and y (row).

A full-width widget has w: 12. Half-screen, w: 6. Most importantly: when you add a widget in portable mode, it is automatically initialised at w: 12 — full width — to adapt to the small screen without any extra configuration. RGL handles automatic stacking of widgets downward (y: Infinity).

RGL grid editor, 12-column surface with widgets stacked vertically

How to edit a mobile page from a PC

An important subtlety: you create pages from a PC screen, but preview the result on a smartphone. The editor therefore displays the grid inside a container whose width simulates a smartphone (approximately 390px). You drag the widgets, resize them — and see in real time how they will look on the operator's phone.

RGL calculates positions in relative units (columns/rows). When the app opens on a real smartphone, the columns resize proportionally to the actual screen width. A w: 6 widget occupies exactly half of any phone, whether it is 360px or 430px wide.

Limits that appeared very quickly

The system works very well for its intended use: mobile visualisation. But very quickly I thought that LivePLC could also be used on fixed supervision screens in control rooms — 24 or 27-inch Full HD monitors.

And there, the vertical grid layout shows its limits. On a 1920×1080 screen, having all widgets in a single full-width column is an ergonomic disaster. Horizontal space is wasted, you have to scroll vertically to see all the information, and you completely lose the synoptic view you can have with a real SCADA.

⚠️
The harsh reality An industrial process synoptic — piping, tanks, conveyors positioned in 2D — is physically impossible to build with a vertical grid. Free pixel positioning is an absolute necessity for this type of interface.

The conclusion was clear: there needed to be two distinct and equivalent layout modes. And the same page would need to support both simultaneously, with automatic conversion in both directions. But before that, I already had a TODO list growing by the hour. I would come back to it later with the Fixed Mode ↔ Portable Mode switch.

🎯
My priority now: evolve visual tags into autonomous widgets, find a version-tracking system so as not to disrupt projects already in production, and make sure everything is fluid and accessible even for a newcomer...

Toolbar, component versioning and built-in properties

The two layout modes did not yet exist at this stage — the pivot came a few weeks later. Versioning and the Resource Monitor were the major additions of this session. The goal of versioning: each widget should be a self-describing autonomous unit, and the editor should never need to know the specific properties of each component. The deeper stake was this: the Dashboard code should only implement its own editing features — it should become generic, its load minimised to stay responsive as the widget library grows. Without this architecture, each new widget would have burdened the central component. With it, the Dashboard can embed any future widget without knowing about it in advance.

Toolbar, widget categories, properties panel, selected widget

Goal of the day: make the Dashboard generic by decoupling widget definitions from the editor, and measure the impact of pages on browser performance

The WIDGET_REGISTRY, single source of truth

Each widget is registered in WIDGET_REGISTRY, a central dictionary. An entry maps a type ("GaugeWidget") to: its React component, its version, its default values, and its list of configurable properties.

WIDGET_REGISTRY = {
  "GaugeWidget": {
    component: GaugeWidget,
    version: "2.1",
    defaultConfig: { min: 0, max: 100, unit: "" },
    defaultW: 3, defaultH: 3,
    definition: {
      properties: [
        { key: "min", type: "number", label: "Minimum" },
        { key: "max", type: "number", label: "Maximum" },
        { key: "unit", type: "string", label: "Unité" },
      ]
    }
  }
}

When LivePLC loads a page, if the version stored in the database is lower than the registry version, an automatic migration is offered — new properties receive their default values. Goal: an old project must remain compatible with all versions of LivePLC and widgets to allow smooth migrations and improvements.

The auto-generated properties panel

The properties panel on the editor side is dynamically generated from the definition.properties list of the selected widget. Supported property types:

  • tag — selector with autocomplete on available tags
  • number — numeric field with validation
  • string — free text
  • color — colour picker with industrial palette
  • boolean — on/off toggle
  • select — drop-down list
  • tagList — multi-tag selection (multi-curve charts)

Changes are visible in live preview immediately — without saving. It is a UX detail that completely changes the pace of work.

Properties panel, tag selector, color picker, live preview

Widget templates

A template is a widget configuration saved with a name. You create it from any configured widget. Templates appear in the toolbar in a dedicated section. Dragging a template onto the page instantiates the widget with all its properties ready — including in fixed mode with the appropriate dimensions.

The "Import from the other mode" feature, explained in the next article, also relies on this system: imported widgets keep their configuration (colours, thresholds, associated tags) — only positions change.

A multitude of templates for a single component:

Templates section in the toolbar, list with preview, Save as template button

But also the ability to create custom blocks by selecting widgets in the layout, handy for reusing them on other pages:

Widget selection for creating a custom block
Custom block available in the toolbar
Practical gain On a project with 12 identical production lines: configure line 1, save the widgets as templates, duplicate the page 11 times replacing the tag IDs. Both modes (fixed and portable) are duplicated together.

The Resource Monitor, ensuring pages stay responsive

One of the problems I explicitly wanted to avoid with LivePLC is latency. Not network latency to the PLCs — that is manageable — but display latency, that one-second freeze where the interface stutters when navigating between pages. That is exactly what you experience with many existing supervision software packages, and it is often what drives operators to complain — and rightly so.

To measure this objectively, I developed the Performance Monitor in parallel with versioning. Accessible via the "System Stats" button in the navigation bar, it overlays on any viewed page without disrupting it:

System Stats button in the LivePLC navigation bar
The "System Stats" button in the navigation bar — accessible in edit mode, hidden in runtime mode
Performances Monitor,  panneau principal avec FPS, DOM, ping, payload
Main panel on an active page: 13 FPS, 39 widgets, 1099 DOM nodes, 28 PLC tags, 4 ms ping, 6.99 KB/payload. Here we see the problem: 13 FPS — page slightly too heavy for the hardware running it, or perhaps a few optimisations needed...
Performance Monitor, chart view, RAM, FPS and DOM over time
"Time evolution" view, 34 logged data points. RAM max 96 MB, FPS max 60, DOM max 1181 nodes. Last page: "Flow rate monitoring"

The DOM: the unexpected bottleneck

The panel displays six key indicators in real time for the open page:

🖼️ FPS (UI Engine)
Frames per second for the React render. Below 30 fps on a static page, there is a problem.
🧩 Widgets / Renders/s
Number of active widgets and re-render frequency. A widget that redraws too often wastes resources unnecessarily.
🌳 DOM Nodes
Number of HTML elements on the page. This is the main indicator of page weight — 1062 in the example below.
📡 Ping / Socket/s
Network latency to the server and Socket.io message frequency — the direct link to field responsiveness.
📦 Payload (KB)
Weight of data received per socket. Too high = too many tags or too much data irrelevant to this page.
🔖 PLC Tags
Number of PLC tags currently active on the page — directly linked to network load.

The DOM: the unexpected bottleneck

While developing this tool, I put my finger on something I had not been measuring until then: in a browser, every visible HTML element is a node in the DOM (Document Object Model). The more nodes a page has, the harder the render engine works on every update — even if few nodes are actually changing. In the screenshot above, we see 1062 DOM nodes for a production supervision page: a figure to watch, because beyond a certain threshold animations and updates start to stutter.

In practice: a page with 40 well-designed widgets can be lighter than a page with 15 poorly optimised widgets, if those 15 widgets each generate a hundred nested nodes. The Performance Monitor makes this phenomenon visible and measurable without leaving the interface.

That is why I chose to provide it directly inside LivePLC — not in a developer console. The person building supervision pages should be able to check that what they are creating will not slow down the system in production. A page's responsiveness is not just an infrastructure question: it is also a design question.

⚙️
Log and Snapshot The "Start Log" button records metric evolution over time and displays it as charts. "Snapshot" captures the current state as a reference to compare two versions of the same page, before/after widget optimisation.

The architectural pivot: Fixed PC Mode and Portable Mode, independent on the same page

🔀
Key decision, dated precisely from my archives
Archive 01/03/2026 : "DisplayWidget bug fixes and start of dashboard evolution to differentiate Fixed page from Mobile page"
Archive 02/03/2026 : "Added Fixed Mode and Portable Mode views to improve mobile small-screen experience, harmonised themes and page properties with settings general tab"
This refactoring is probably the most important architectural change in the project. It required rethinking the page data model and implementing two distinct rendering engines on the same editing surface.

On 1 March 2026, while fixing bugs on the DisplayWidget, I started differentiating pages by their destination — PC screen or smartphone. The next day, both modes coexisted on the same page. A LivePLC page can now simultaneously have a PC version and a portable version, completely independent of each other.

Settings, configuration page PC et mode portable

Goal of the day: resolve the conflict between the PC synoptic view and the mobile list — without creating pages twice

Fixed Mode (PC), absolute pixel positioning

Fixed mode completely abandons the RGL grid. Widgets are freely positioned on a fixed-resolution canvas — Full HD (1920×1080) by default, configurable per page (HD, 4K, custom resolution). Each widget has an absPos: { x, y, w, h } object in pixels in its configuration.

This is the synoptic mode par excellence. You place elements exactly where you want, overlay process background images, position gauges next to their equipment on a layout plan. No grid constraints — total freedom.

Moving and resizing are done with drag handles directly on the widget, with optional snapping to magnetic guides (horizontal and vertical reference lines).

Synoptic in fixed mode, process image overlay, positioned gauges

Portable Mode (Mobile), 12-column RGL grid, unchanged

The portable mode stays the same — the 12-column React-Grid-Layout grid described in the previous article. Widgets stack vertically, adapting to all screen sizes. The only difference: it is now an optional mode, activatable page by page.

⬛ Fixed Mode (PC)

  • Absolute X, Y position in pixels
  • Fixed-resolution canvas (configurable)
  • Free positioning, overlapping allowed
  • Perfect for synoptics and complex dashboards
  • Stored in items[].config.absPos
  • Render: absolutely-positioned div on canvas

📱 Portable Mode (Mobile)

  • Position in RGL columns/rows (1-12)
  • Fluid width based on real screen
  • Automatic stacking, vertical scroll
  • Perfect for field supervision and maintenance
  • Stored in portableItems[]
  • Render: responsive React-Grid-Layout

The data model: items + portableItems

This is where the elegance of the solution lies. A LivePLC page stores two independent lists of widgets:

  • items[] — the list of Fixed (PC) mode widgets, with their absolute positions in pixels.
  • portableItems[] — the list of Portable (mobile) mode widgets, with their positions in RGL grid units.

A widget can exist in both modes with different visual configurations (sizes, positions), or only in one of them. The hasPortable property in the page configuration indicates whether a mobile version has been created.

On the editor side, the activeItemsKey variable toggles between 'items' and 'portableItems' depending on the active mode. All operations (add, move, delete, save) apply to the active list.

Automatic mode detection at runtime

At runtime (outside of edit mode), LivePLC automatically detects which mode to use:

  • If the screen is small AND the page has a portable mode (hasPortable: true) → portable mode activated automatically.
  • If the screen is large OR the page has no portable version → fixed mode.
  • If the page itself is configured in grid mode (layoutMode: 'grid') → portable mode on all screens.

In practice: an operator consulting from an HD supervision tablet sees the PC layout. The maintenance technician who opens the same link on their smartphone sees the mobile layout. With no additional configuration.

Layout fixe PC
Layout portable smartphone
Same URL, two renderings: side by side, fixed PC layout (left) and portable smartphone layout (right)

Generating one mode from the other, without recreating the page

The feature I like most in this system: the "Import from the other mode" button. It allows automatically generating a portable version from an already-built fixed page, or vice versa.

Fixed → Portable: widgets from items[] are copied into portableItems[]. Each widget is initialised at w: 12 (full width) and y: Infinity — RGL stacks them automatically in order. You get a working mobile version in one click, to be refined afterwards if needed.

Portable → Fixed: column/row positions are converted to absolute pixels via convertGridToAbsolute(). Widgets are placed in a regular grid on the PC canvas. Less precise than manual creation, but it gives a good starting point.

// Import depuis l'autre mode (simplifié)
const sourceKey = isPortableMode ? 'items' : 'portableItems';

if (isPortableMode) {
    // Vers portable : w=12, y=Infinity → RGL empile automatiquement
    newItem.x = (idx * 2) % 12;
    newItem.y = Infinity;
} else {
    // Vers fixe : conversion colonnes → pixels
    itemsToImport = convertGridToAbsolute(items, canvasWidth);
}
💡
In practice on a project Typical workflow: I build the PC page (complete synoptic in fixed mode), then generate the mobile version in one click, and adjust only the widgets that do not display well in column — usually the complex synoptics that I replace with individual gauges.

From visual tag to widget part 1: Visual tags, the abstraction between PLC and operator

In the very first version of LivePLC, widgets displayed data as-is: a Modbus address, a raw value, a generic label. Something like %MF4294 = 30745.08. Useful for debugging, but unusable for an operator who does not know their PLC's memory addresses.

System tag list v1, raw Modbus addresses visible
Before visual tags — the variable list with raw PLC addresses (%MF4304, %MW4276:3…)
After visual tags, display with readable labels and units
After — the same data, but with readable labels, units and a value range

Idea of the day: create an abstraction layer between raw PLC addresses and the operator display — so the interface no longer speaks in registers but in business values

What is a visual tag

A visual tag links a PLC address to a human-readable display. It contains: a readable name ("Polyol tank 1 level"), a unit (kg, °C, %, V…), a min/max range for scaling, colour thresholds (green = normal, orange = warning, red = alarm), and the number of decimal places to display.

But what makes it a foundational concept is the multiplier effect: once the visual tag is configured, I can use it in any widget. A gauge, a thermometer, a numeric display, a mini-trend — all will read exactly the same definition. If I fix the unit or the thresholds, all widgets update automatically, across all pages, in both layout modes.

The two screenshots above show the difference in concrete terms: on the left, the raw variable list with Modbus addresses — what a developer sees. On the right, the same data after the visual tag layer — what an operator or technician sees.

💡
The core insight The PLC address does not need to exist in the user interface. It is the role of visual tags to perform this translation. This separation between what the PLC reads and what the operator sees is what makes LivePLC configurable without knowing PLC programming.

From visual tag to widget part 2: From numbers to visuals, gauges, thermometers and tanks

Displaying values as a list is useful — it served me well during the first few weeks. But a supervision interface should show things, not just list them. When an operator looks at the temperature of a preheating oven, they should see "60°C on a red gauge" and immediately understand it is in the normal zone — not read "60.3" and mentally search for whether that is good or not.

That day, I built the first truly visual widgets: the circular gauge, the thermometer, the level bar and the animated tank.

Thermometers in production, 60.3°C and 40.9°C in real time
Sheet preheating — two real-time thermometers (60.3°C and 40.9°C). These are real data, read directly from the PLC.
Niveaux cuves polyol,  barres de niveau avec valeurs en kg
Polyol tank levels — fill bars with value in kg. One tank selected for production (ON), the other not.

Goal of the day: moving from raw value lists to visual representations — a supervision interface should show, not just list

The circular gauge

This is the reference widget for analogue measurements. The arc colours according to the configured zones: green for the normal range, orange for warnings, red for alarms. Thresholds are defined in the visual tag, not in the widget itself — which means a gauge created from a well-configured tag is ready to use with no additional setup.

The thermometer and the tank

The thermometer is a vertical variant with a more intuitive representation for temperatures. The tank (TankWidget) deserves a special mention: it has a gentle wave animation that makes reading the level more natural — you "see" the liquid rather than reading a percentage.

Widget templates

A feature added that same day: templates. A template is a widget configuration saved with a name. Once the thermometer is properly configured for preheating temperatures (range 0-150°C, green 20-90°C, alarm at 100°C), I save it as a template. On the next page, I drag the template and the widget is ready — I only need to change the source tag.

📝
The screenshots above are from v1 in real production. The visible data (temperatures, levels) are those of the line at that precise moment. That is the advantage of a tool built in the field: the first tests use real data, not simulations.

From visual tag to widget part 3: A command button, or writing to the PLC from a browser

Visualising is half the work of a supervision system. The other half is acting: starting a motor, changing a setpoint, opening a valve. That day I added the first command widgets, including the setpoint slider — and that is when I realised that writing to a PLC from a browser deserved careful treatment.

Goal of the day: allow the operator to act on PLCs from the interface, with safety mechanisms adapted to an industrial context

The write logic

When an operator moves a slider, a value must be sent to the PLC. On the backend side, the tag must be declared in RW (read-write) or W (write-only) mode. The POST /api/write route receives the value, calls writeTag() on the correct protocol handler, and the PLC receives the setpoint within a few milliseconds.

Writes do not follow polling cycles. They are event-driven — triggered by user interaction, not by a loop. The only speed limit is the network latency between the Node.js server and the PLC.

The slider: write on release, not continuously

Paramétrage du widget slider
Widgets sliders et boutons de commande

For a temperature or speed setpoint, sending the value at every pixel of slider movement would be counterproductive. I configured the slider to write only on release — when the operator lets go of the cursor, the value is sent once. While dragging, a local display shows the target value without sending anything to the PLC.

This detail matters in an industrial context: a setpoint that changes 50 times per second during a mouse drag can trigger oscillations in the control system. Writing on release eliminates this risk.

Double-tap confirmation for critical commands

Paramétrage bouton action avec confirmation double-appui

The momentary button sends 1 while pressed and 0 on release — like a wired pushbutton. For critical commands (motor start, process valve opening), a two-step confirmation dialog intercepts between the click and the send.

On a smartphone, this mechanism is essential: an accidental touch on a "Start" button in portable mode is far more likely than on a mouse. Double-tap confirmation makes this risk negligible.

💡
Golden rule for commands All the safety logic (validating that the tag is RW, limiting values within range, critical confirmation) lives on the Node.js backend — never in the React code. The frontend can be inspected and modified in the browser; the backend cannot.

From visual tag to widget part 4: The foundations are solid, new components developed at full speed to reach the next visual level

Once WIDGET_REGISTRY is in place and the properties panel is auto-generated, creating a new widget becomes a matter of a few hours. The foundation is solid: each component knows how to configure, version and migrate itself. All that is left is to build on top of it.

The following weeks see new components rolling in at a sustained pace:

📝
TextWidget 13/02
Static text with formatting templates, ideal for labels and zone titles.
TextWidget — labels and zone titles
🛢️
TankWidget + ClockWidget 15/02
Animated tank/level with liquid fill. Clock synchronised to shop floor time.
TankWidget — animated liquid level tank
🎚️
SliderWidget 15/02 v2
Linear, rotary or 180°/270° arc slider. PLC tag write on release in real time.
SliderWidget — sliders and command buttons
⚙️
PumpWidget + ValveWidget 17/02 v3
Animated pump (rotation, flow) and valve (open/closed/in-progress), linked to state tags. Automatic pipes between components.
🔔
AlarmWidget 03-04/03
Local/global alarms, 3 severities (info/warning/critical), multi-conditions AND/OR. Evaluation engine on backend side.
📷
WebcamWidget 05-06/03
MJPEG/HLS streams (Axis cameras), video recording, consultable archive with scrollable timeline.
💡
The power of the registry Every widget added automatically enriches the toolbar, the properties panel and the versioning system. Zero "plumbing" code to rewrite for each new component.

The ProductionLineWidget, a 2D digital twin of an industrial production line

🔀
By far the most ambitious widget of the project Its development represents nearly two months of work (on my own time) and has produced more code on its own than all the other widgets combined. It is also the first widget I designed for a very specific industrial context, and then made generic in view of the tracking possibilities this tool offers.

The ProductionLineWidget is a 2D digital twin of a production line. It displays in real time the objects circulating on the line, their position on each conveyor, their state in each zone — all in animated SVG, synchronised with PLC data via Socket.io.

Small simulation example of the twin for a sandwich panel production line:

The demo video does not do it justice as it runs on a very light i5 with many processes already running, but I assure you that on a slightly more powerful or less overloaded configuration, the smoothness is absolutely there.

Goal of the day: build a digital twin of a production line — physics engine on the server side, visible from any browser in real time

The concept: a line made of zones

A production line is modelled as a sequence of zones, each with a type and properties. Zones connect to each other via configurable links — when an object reaches the exit of a zone, it automatically passes to the next one.

➡️
Continuous conveyor
Transport at configurable speed. Objects advance continuously, jam detection.
📍
Positioning zone
Numbered slots. Objects are placed in precise positions before being transferred.
❄️
Buffer zone (cooler)
Temporary storage. Objects wait their turn for evacuation across levels.
🔄
Turner
Flips the object 180°. Tilt animation synchronised with the PLC.
↔️
Shifter
Lateral movement. Direct transit without rotation, for lane changes.
📦
Stacker
Multi-slot elevator platform. Batch accumulation and evacuation.
ProductionLineWidget editor, line configuration
ProductionLineWidget, SVG preview of the line

The architecture: server-side physics engine

This is the most important architectural choice in this widget. The physics engine managing positions, collisions and transitions runs on the Node.js side, not in the browser.

Why? Because the simulation must continue even when no screen is open. In a factory, the line runs 24/7 — the digital twin must reflect the real state at all times, not only when someone has it open in their browser.

// Structure backend/twins/ (moteurs)
TwinMasterEngine.js    ← orchestrateur, gère toutes les zones
ConveyorEngine.js      ← convoyeurs continus
PositioningEngine.js   ← zones de positionnement (slots)
BufferEngine.js        ← zones tampon (refroidisseur)
TurnerEngine.js        ← retourneur (physique + animation)
ShifterEngine.js       ← translateur latéral
PileEngine.js          ← empileur (plateforme élévatrice)
StationEngine.js       ← stations de détection/enregistrement

Each engine emits its state via Socket.io. The React component receives these states and updates the SVG. The frontend calculates nothing — it only renders what the server sends it.

Node.js, Physics Engine ⚙ TwinMasterEngine ↩ TurnerEngine ⇄ ShifterEngine 📦 PileEngine 🏭 StationEngine runPhysicsCycle() 1 000 ms · positions + collisions Socket.io emit('twin-state') TRY_SPAWN / sim-control React, SVG Renderer 📄 ProductionLineWidget.jsx 🎨 Real-time animated SVG 📡 useEffect → socket.on 🔁 Re-render per zone N simultaneous clients Each browser receives the same state in real time 🖥 PC Supervision 📱 Shop floor smartphone 📟 Operator tablet 💻 Control room

This diagram illustrates an architecture that is no accident. ProductionLine's zone type management was designed in the image of LivePLC's toolbar: each zone type (conveyor, turner, shifter, stacker, station, entry point…) is implemented in an autonomous Engine file (TurnerEngine.js, ShifterEngine.js, PileEngine.js…) and registered in a central registry, the EnginesRegistry. The TwinMasterEngine only knows this registry, not the individual engines. Adding a new zone type means creating an Engine file and registering it, without touching the rest of the system. This is exactly the same principle as WIDGET_REGISTRY for widgets: a system open to extension, closed to modification.

Objects on the line — physics and properties

Each object circulating on the line is an entity with physical properties (physicalLength, physicalWidth) and configurable business properties. These properties are fed from a RecipeWidget: the production recipe defines the dimensions and data for each batch of objects to produce.

An object is born in a ZoneEntryPoint — triggered by a PLC tag (trigger_tag_id) or manually in simulation — and travels the line to its exit. At each pass through a ZoneStation, the current PLC tag values are recorded in InfluxDB to build the object's history.

The idea behind ZoneStation

This feature was not in the initial specification. It came from a question I asked myself during development, after watching products scroll past in simulation: "OK, that is great. I can see my panels moving on the line. But now — what more can ProductionLine offer?"

The answer had been there from the start: LivePLC has access to all PLC data in real time. Temperatures, speeds, pressures, fault codes, measured thicknesses. What if that data were attached to products rather than just scrolling through gauges? "I can link PLC measurements to the physical objects passing in front of the sensors. But how?" That is how ZoneStation was born.

Concretely, a ZoneStation is a zone placed in the editor at the location of a real physical station on the line (a press, a quality control station, a cooling exit). It is configured with a list of tag_ids to capture. As soon as an object enters the zone, the physics engine reads the current values of these tags and timestamps them. An object passing through four stations accumulates four PLC data snapshots, each anchored to a precise moment in its journey.

ZoneStation, capture des valeurs PLC au passage d'un objet
🗄️
InfluxDB: archive for later analysis The next question arose naturally: "What if we want to keep this data for several days, several weeks?" InfluxDB comes to the rescue. Each passage snapshot is written to a time series, making it possible to retrieve the complete history of a production batch, compare drifts over time, or detect correlations between a quality defect and an abnormal PLC measurement.
📱
QR code: trace a product with a single scan Last link in the chain: "What if you want to quickly retrieve the data for a specific product after the fact?" Each object generated in ProductionLine is identified by a unique product_id. A QR code printed at line exit instantly recalls the complete station-passage history, from any workstation or smartphone on the shop floor. Suivi d'un panneau, historique des passages de stations via QR code

The link with TimelineWidget and RecipeWidgets

The ProductionLineWidget does not operate in isolation. It integrates with:

  • RecipeWidget: provides the gridMap of PLC tags (PLC addresses) that the twin must read for each object in the recipe.
  • TimelineWidget: the production schedule defines which batches are planned and when — the twin can align its simulation with this schedule.
  • ImportFilesWidget: orders imported from the company management system feed directly into the schedule and, by extension, the simulation.

What this represents in development

The ProductionLineWidget is by far the most complex component in the project. Managing transitions between zones, collision detection, synchronised SVG animations on the client side, 7 different physics engine types, InfluxDB integration: all of this represents two months of iterative development on my own time. Two complete rewrites before reaching this third working version, which still needs to be tested in real conditions, but which is a more-than-promising component. Capable of running in parallel with the PLCs with only a few tags for synchronisation, not counting the tags to archive per product.

Another example: a cartonning line

Widget genericity The ProductionLineWidget is designed to be configured graphically via the editor — without code. You place the zones, connect them, configure the properties, and the simulation starts. It can represent any production line: sandwich panels, wood, metallurgy, food processing.

To illustrate this genericity, I configured a second production line: a cartonning process. Conveyors, control stations, stacking zone, exit point — the layout is entirely different but the physics engine is the same. Not a single additional line of code, just a different configuration in the editor.

ProductionLineWidget configured for a carton packaging line
⚙ Next module in development

ProductionLine in practice: using recorded data in real time

Watching your products move on a line in real time is already impressive. But the real value of ProductionLine is not there. It lies in what you do with the data the line accumulates at each station pass. These timestamped PLC tag snapshots, associated with each object circulating on the line, are the foundation of a real-time defect detection tool.

Two automatic detection modes

The component can identify at-risk products in two complementary ways:

📐
Identical passage characteristics
If several defective products share the same passage values at a given station (same speed, same temperature, same pressure), ProductionLine can automatically group similar objects still on the line and flag them.
⚠️
Out-of-tolerance PLC tags
Each archived tag can be configured with min/max thresholds. As soon as an object passes a station with an out-of-tolerance value, the component automatically marks it in red directly on the line visualisation.
🎯
Fast defect targeting on the line
As soon as a defect is identified on a product, ProductionLine immediately traces its origin: the responsible workstation, exact position on the line, and time before it exits. All products that passed through the same station with similar characteristics are highlighted. You know exactly where to intervene, when, and which other products to inspect — without stopping production.

Direct visualisation on the line

Highlighting happens directly on the ProductionLine SVG rendering: suspect products appear in red or orange according to criticality level, visible at a glance from any workstation or smartphone connected to LivePLC. The operator does not need to navigate through data tables — problems are displayed where they physically are, on the line representation.

The bump example

An operator notices a bump on a panel being manufactured. They click on it in ProductionLine and mark it red. The component immediately traces back: this anomaly appeared at blade no. 150, which will exit the forming machine in exactly two minutes. No more searching all over the line: you know right now where to intervene and when. Subsequent products that passed the same blade with identical characteristics are also highlighted: the operator knows exactly which panels to inspect before they reach the end of the line.

🔧
Targeted maintenance, fewer stops Today, detecting the origin of a defect on an industrial line often means stopping production to inspect each station. With ProductionLine, intervention is surgical: you know which station, which product, which time window. The line keeps running while maintenance intervenes at the right place at the right time.
📈
Long-term: drift before the defect The InfluxDB history does not only serve to trace a product after the fact. By analysing trends over several days, ProductionLine will be able to detect a progressive drift in a PLC tag before it crosses the tolerance threshold. Moving from corrective to predictive maintenance — that is the next step.

JWT: managing authorized devices accessing LivePLC's protected data

Very early in development, a problem arose: how to manage several different devices in the same factory — a fixed operator PC, maintenance tablets, supervision screens on the lines — with different permissions and home pages for each one?

The usual solution would be a user accounts system. I preferred a different approach, better suited to the industrial context: device-based authentication.

Enregistrement d'un appareil, authentification par appareil dans LivePLC

Goal of the day: manage dozens of heterogeneous shop-floor devices with different permissions, without a complex accounts system

Per-device JWT, persistent identification

When a device connects to LivePLC for the first time, it generates a unique device_id (UUID) stored in localStorage, and requests access to the server. The administrator validates the device from Settings — assigning it a workstation name, a department and a start page. The server issues a signed JWT, also stored in localStorage.

Validation d'un appareil par l'administrateur dans LivePLC

On each reconnection, the JWT is verified server-side. If valid: the device immediately finds its context (department, home page) — with no password entry required. If the JWT is expired or revoked, the device goes back through the approval cycle.

pending
New request, awaiting admin approval.
approved
Access validated. Active JWT, department context loaded.
👤
guest
Unknown device, restricted access (except kiosk mode).
🔒
rejected
Access denied, blocking screen. Retry not allowed.
🌐
The network IP change problem A JWT is tied to the web page origin (server IP:port). If the server IP changes (network switch, router move), the browser considers it a different site and loses the JWT. The solution: configure a fixed hostname liveplc.local via the client hosts file. The IP address can change — localStorage remains intact.
💡
A device fleet managed like Netflix licences Centralised access management allows the administrator to track all workstations connected to the LivePLC server at any time: see who is connected, authorise a new workstation, revoke a compromised or replaced one. In the event of a hardware failure, a new PC unknown to the server can be validated in seconds from Settings, with no licence file manipulation or intervention on the failing workstation.

It is a bit like Netflix: I have a certain number of simultaneous connections to distribute across as many workstations as I select. The licence lives on the server, not on the workstation. No more worry about a licence being corrupted on a failed hard drive.

QRCodePage, kiosk access and what will become a full standalone application

QRCodePage, temporary kiosk access

The QRCodePageWidget generates a QR code pointing to a specific LivePLC page. When an unregistered device scans this QR, it opens the page in kiosk mode — read-only, with a limited duration (configurable on the widget), and no access to the rest of the application.

A "Kiosk Mode — Read Only" banner is displayed on the smartphone connected to the same wifi network as LivePLC, with a visible countdown. On expiry, access is revoked and the user is redirected to a "Session ended" screen. If the browser is closed before expiry, the kiosk session is cancelled (sessionStorage rather than localStorage — expires on browser close, by design).

Smartphone view after scan, Kiosk Mode banner, visible timer, supervision page in read-only mode

Here the camera screen is shared for 10 minutes via the QR code. Once the QR code is scanned, it is consumed and a new one must be generated to allow another visitor or registered device to access this page directly.

🌀
Creative drift, or how a QR code becomes a platform What follows is an intentional development drift. As with ProductionLine, the more you build a tool, the more ideas arrive — and sometimes the hardest thing is knowing when to stop. I did not stop here. I spent two days building components that no longer had much to do with industrial production supervision.

But this drift was not fruitless. On the contrary, it opened the door to an entirely new application — and even more than that, a platform of interconnected applications that I will present in upcoming articles.

Equipment QR codes, the workshop document hub

The QR codes system goes further than simple page consultation. Each piece of equipment in the factory can receive a printed QR code stuck on it. The scan opens a page dedicated to that equipment, with several types of configurable content:

  • Documents: PDFs, images, web links, technical manuals.
  • Dashboard page: direct link to a LivePLC supervision page.
  • Time tracking: entry/exit form for breaks or interventions.
  • Quality control: full form with photo, signature and compliance status.

Documents are filtered by authorised department — Maintenance, Production, Quality, Safety. A maintenance technician does not see documents reserved for the Quality department, and vice versa.

Equipment hub after QR scan, list of documents and available actions
Equipment hub, configuration view, filtering by department

Integrated quality control

Quality control is directly integrated into the equipment hub, accessible with a single scan. The form offers five options:

Compliant
Photo + controller name + touch signature
⚠️
Compliant with reservations
+ detailed reservations field
Non-compliant
+ mandatory non-conformity field
📋
Procedure
Reference documents linked to the equipment
📁
History
Chronological list of past inspections

Each inspection is timestamped and stored in the database — photo in base64, vector signature, status, controller name. The history is consultable from any authorised device.

💡
Towards a dedicated app This QR codes and forms system grew so much that it became a full application in its own right: Qwipment. We will come back to it in an upcoming article.

Back to basics: future evolution of LivePLC communication protocols

One of the recurring criticisms of web supervision tools is their dependence on proprietary gateways to communicate with PLCs. Either they only speak OPC UA, or they require an expensive third-party middleware to connect Modbus.

LivePLC integrates the drivers directly into its Node.js backend. Currently: 4 active protocols (ready to use) and 13 stubs (architected, activatable by installing the corresponding npm package and a few production tests to validate them).

Goal of the day: not be limited to a single PLC manufacturer — architect an extensible multi-protocol system for any machine fleet

The 4 active protocols

🔌
Modbus TCP
jsmodbus · port 502 · Coils, Holding/Input Registers, MW/MD/MF/MB · Automatic batching of contiguous addresses · Schneider, Wago, Beckhoff, Yaskawa/Danfoss drives...
🔷
Siemens S7
nodes7 · port 102 · S7-1200/1500/300/400, ET200SP · Adressage MW, DB, bits M/I/Q · PUT/GET requis sur TIA Portal
🌐
OPC UA
node-opcua · port 4840 · Standard IEC 62541 · Auto-reconnect · Configurable TLS security · Compatible S7-1500, Beckhoff, B&R, Codesys...
🔗
REST / HTTP
axios (natif) · Polling JSON · Passerelles IIoT modernes, API industrielles, compteurs intelligents

The 13 stubs, activate in 4 files

The architecture is designed so that adding a protocol is purely a matter of configuration. Each protocol exposes the same interface (connect, disconnect, readTags, writeTag) and is referenced in a central PROTOCOL_REGISTRY.

Activating a new protocol takes 4 steps: create the driver file in backend/protocols/, register it in index.js, add its specific columns in database.js, and add the option in Settings.jsx.

# Protocol Sector npm Complexity
1 Modbus RTU/TCP General already installed ★☆☆
2 WebSocket IIoT ws ★☆☆
3 MQTT IIoT / Cloud mqtt ★☆☆
4 EtherNet/IP (CIP) Allen-Bradley / Rockwell ethernet-ip ★★☆
5 MC Protocol (Mitsubishi) Japan / Asia industry mcprotocol ★★☆
6 BACnet/IP Building / BMS bacstack ★★☆
7 KNX/IP Building / home automation knx ★★☆
8 FINS (Omron) General industry omron-fins ★★☆
9 CANopen Machines / drives node-canopen ★★★
10 DNP3 Water / long-distance SCADA node-dnp3 ★★★
11 IEC 60870-5-104 Electricity / grid operators node-iec104 ★★★
12 IEC 61850 MV/HV substations node-iec61850 ★★★
13 HART-IP Process instrumentation hart-ip ★★☆

Why stubs were architected so early

The decision to architect the stubs from the start rather than waiting for customer requests comes from a simple conviction: in industry, the PLC fleet is heterogeneous. A factory rarely has just one PLC manufacturer. A Schneider line sits alongside a Siemens conveyor, Mitsubishi drives, and sensors with Modbus outputs.

Proposing a tool that only talks to Siemens or Modbus is closing the door on half the projects. Having the stubs architected lets you say: "OPC UA? Ready. Allen-Bradley? 20 minutes to activate EtherNet/IP. BACnet for building systems? Available."

Settings, PLC Connections tab: list of connected PLCs, protocol selector
📝
Roadmap The MQTT and WebSocket stubs are next to be fully activated — they cover modern IoT sensors and IIoT gateways. EtherNet/IP (Allen-Bradley) will follow to address the North American market.

Qwipment, when a sub-module becomes a full application in its own right

While developing the equipment QR codes system in LivePLC, I gradually built something that had little to do with industrial supervision. Forms, document management, intervention histories — useful, but foreign to the primary calling of a SCADA.

The conclusion was clear: this part deserved its own application. Qwipment was born from this realisation.

The idea: LivePLC's QR codes had grown so much they deserved their own application

The name

Qwipment is a stylistic twist on "Equipment". The leading "Q" is a nod to the QR code without spelling it out. Pronunciation: "Kwipment". Registered domains: qwipment.fr and qwipment.com.

Slogan: "Scan. Connect. Know." — the same workflow as LivePLC, but applied to equipment management rather than process supervision.

What Qwipment does

Qwipment is an industrial QR code manager. Each piece of equipment receives a unique QR code. The scan opens a page dedicated to the equipment, with:

  • Its documents (manuals, technical sheets, procedures)
  • Its forms (attendance, quality control, checklists, custom)
  • LivePLC supervision pages if the equipment is connected to a PLC
  • HATALINE actions if a CMMS is in place (periodic inspection, work order...)
QR code équipement — page dédiée avec documents, formulaires, supervision

The key idea: the Suite Connector

This is the concept that differentiates Qwipment from a simple document manager. Qwipment is not a silo — it is a hub that aggregates content from the entire software suite.

Each application in the suite exposes a standard endpoint:

GET /suite-connector/contents?uid={equipment_uid}

// Réponse LivePLC :
[{ "app": "LivePLC",  "type": "supervision_page",
   "label": "Page Ligne 1", "icon": "monitor" }]

// Réponse HATALINE :
[{ "app": "Hataline", "type": "form",
   "label": "Vérification périodique", "icon": "clipboard-check" }]

Qwipment queries all configured connectors and displays results grouped by application, with each app's colours. A single QR scan → Qwipment documents + LivePLC supervision page + HATALINE maintenance actions — depending on what the user's department is authorised to see.

Résultats groupés par application après un scan QR — Qwipment + LivePLC + HATALINE

⚡ LivePLC

  • Real-time supervision
  • Process alerts
  • Digital twins

🔗 Qwipment

  • Universal QR hub
  • Forms / docs
  • Connects everything

🔧 HATALINE

  • CMMS maintenance
  • Assets / work orders
  • Inventory / scheduling
🚀
Project status Qwipment is functional and in active development. LivePLC integrates the Suite Connector on the server side to expose its pages to Qwipment scans. HATALINE is being adapted to expose its maintenance actions in the same way. The three applications will form a coherent suite whose interconnection is the main differentiator.

One QR code, different experiences by role

This is where the Suite Connector reveals its full power. Each department head independently configures their own access rules through the same Qwipment interface. A single QR code per piece of equipment — but the content displayed is entirely personalised based on the profile of the person scanning.

🔧
Maintenance technician
Technical documents, safety data sheets, data shared with everyone. LivePLC supervision pages linked directly to this equipment. HATALINE spare parts inventory and full intervention history for the equipment.
📋
Quality manager
Documents shared with everyone, plus their own checklists and forms restricted to the quality department. Automatically receives result reports by email whenever a checklist is submitted by an operator.
👤
Visitor
Connected to the platform Wi-Fi, no account needed. Access to public documents, safety data sheets (useful for firefighters or emergency services), zone attendance form.
🧪
Lab technician
LivePLC flow and pressure monitoring pages linked to the equipment. Their own chemistry control checklists and measurement forms specific to the laboratory, inaccessible to other departments.
Scan QR

Everything is independently configurable by each department head, through the same interface, in the same application, with the same QR code for each piece of equipment. The technician, the quality manager and the visitor all scan the same code — each sees only what their profile authorises.

Already live Role management, per-department content filtering and automatic email report delivery are all operational. This is not a roadmap — it is the reality of the system as it works today.

A mid-year checkpoint and short-term goals

It is already June 2026. Looking back since early January, I realise I have not been idle, and I have certainly not counted the hours spent in front of a screen. Pretty proud to have shipped two applications with real potential, and to see a genuine suite taking shape.

Jan June Dec 2026
🔧
Hataline
CMMS / Workshop
LivePLC
SCADA Supervision
📱
Qwipment
Equipment QR codes
Jeremy Lagache
Jérémy
Automation engineer / Maintenance technician
developer & software architect
(in his spare time)

LivePLC first : a full web SCADA supervision platform, multi-protocol (Modbus TCP, Siemens S7, OPC UA), with modern, reactive, fully customisable components, free-layout synoptic pages on PC, smartphone-adapted portable views, a 2D digital twin of a production line, InfluxDB historisation, fine-grained per-workstation access control and QR kiosk mode. Then Qwipment : an industrial QR code manager that gradually absorbed everything LivePLC was never meant to handle. And then there is Hataline, my first CMMS project, started in September 2025 at my younger brother's request for his company: I still need to write about it in the blog, as I realise I have not explained anything about the software yet, but thankfully my GitHub archives are well documented, which will help me with the write-up for future articles. So three applications, three distinct problems, one interconnected platform all the same.

The time has come to polish everything and, above all, to move toward a real production deployment : beyond my desk PC and smartphone. Once that step is engaged, there will also be other things to think about: how to get the word out about the software, whether it addresses a real demand, whether to prepare trial or partner licences before any commercial launch. There are aspects I am far less comfortable with than ideas for improvements, optimisations and new features in my field… And once that step is well underway, I can turn my attention to another industrial project that has been on my mind for a while, and which might complete the platform.

Perhaps a goal for next year. But for now, I still have six months left to complete, improve and finalise this early-year challenge, which has grown quite substantially at breakneck speed.
Project lifecycle goals · H2 2026
June July Aug. Sept. Oct. Nov. Dec.
🎯 September 2026
All 3 applications in 24/7 production testing on at least 2 sites.
🚀 December 2026
Commercial launch of the 3 products : ≥ 1 site with on-site installation & training · 1 site autonomous self-install · remote server maintenance.
Development goals (features & improvements) · H2 2026
🔧 Hataline
  • To be filled
⚡ LivePLC
  • To be filled
📱 Qwipment
  • To be filled

Roadmap dev LivePLC: Drawing from field experience to imagine future tools > predicting failures, automating expertise and everything left to do...

Since the very first commit of LivePLC in January 2026, I've been keeping a list of every idea that crosses my mind : features to add, optimizations to make, bugs to fix, tracks to explore. It lives in my personal todo app, and it just keeps growing with every dev session and my day-to-day fieldwork. Every problem solved generates two new ones; every new feature reveals three use cases I hadn't thought of.

Here is a full inventory, sorted by category: what's been done, what still needs doing, and above all what seems most promising in the short term.

⭐ Most promising modules : high priority
🧠 Learning widget : two concrete use cases
① Cutting blade management
Today, the machine cuts according to the curve chosen by the operator : no dynamic management. The module could archive data from each cut (speed, position, product type, order) and analyze curves to find optimal parameters for each production profile. Expected result : adjustments would adapt automatically to current production, the operator would no longer have to worry about the cutting profile and we could go from 400 to 600 cuts per blade.
② Automated foam startup
The startup of production at the foam station is a critical moment entirely managed by hand : head movement, line speed, real-time adjustments. The module archives all operator actions and sensor data (flow, pressure, temperature, humidity, production type), classifies them and generates a library of startup profiles by production type. Eventually : the module manages the startup alone and optimizes it — the operator focuses on other tasks, and no loss of expertise if the operator is absent.
🔮 Predictive tools
The problem : the blade that cuts products eventually breaks ... and it happens at an uncontrolled time. We stop production in an emergency, products in progress go to waste.

The solution : vibration and heat sensors placed on the blade guides feed the widget. After one month of collection, it maps the detailed wear curves and can then predict: "in 50 cuts, the blade will break." We schedule a clean shutdown at the right time : less waste, zero unplanned stop.
🧪 PIR/PUR foam simulation
Real-time chemical twin : predict cream time, gel time and expansion height based on ambient humidity, line speed and recipe. The module calculates the correction automatically before the defect appears.
New modules & widgets
✅ Done
  • Data logger widget
  • Camera widget
  • Grafcet widget (pulse, glass, centering)
  • QR code page widget (kiosk, maintenance, stats)
  • Navigation bar + navigation page
  • Floating side toolbar
  • Image / logo in navigation
  • Performance monitor (snapshot + comparison)
  • Legacy learning module → converted to widget
⬜ To do
  • ★ AI learning model widget
  • ★ Live PIR/PUR foam simulation
  • ★ Predictive tools / FFT widget
  • Timeline widget (planning, drag & drop)
  • Auto statistics widget (auto-detects post widgets)
  • AR smartphone/smart glasses vision (sensor data overlay / alerts / predictions)
  • Email / SMS communication widget
  • Preset value selector widget (stacked button bargraph)
  • Event journal (timeline + auto report)
  • Io-link / MQTT y-path
  • WebSerial API (legacy RS-232/RS-485 sensors)
ProductionLine & digital twin
✅ Done
  • 2D twin with InfluxDB + arrival notifications
  • Panel-to-check tracking (visual flagging)
  • Printer position tag → message generation
  • ProductionLine component with zones, encoder, count
  • Time spent by object in a zone
  • Save point: snapshot values at key zones
  • Buffer zones (accumulator, sorter, ejector)
  • Saveable line templates
  • Line zero point (precise machine distances)
  • Unique ID for zones on insertion
  • Accidental deletion protection
⬜ To do
  • Unit count / linear metres in a portion (cooler)
  • Alerts on marked object entering/leaving a zone
  • Storage zones (forklift + space optimization)
  • Simulator: saw animation (cut + return to zone start)
  • 2nd evacuation exit for a zone
  • Infer defect location (blades, claws, sheet)
  • Equipment QR codes positioned on the twin
Editor, UX, tags & connectivity
✅ Done
  • Zoom in page editor
  • Multi-select (rubber band + shift-click)
  • Group / ungroup components
  • Export / import projects and pages
  • Component version number
  • Show page widgets in toolbar
  • Force dashboard pagecard mobile mode
  • Adapt phone display (absolute mode)
  • Settings button access from smartphone
  • Kiosk mode (block interactions + page redirect)
  • Mobile save button fixed
  • Estimated end-of-production calculation
  • Tags: duplicate batch with regex offset
⬜ To do
  • Color scheme + global theme across all widgets
  • Editable font size per widget
  • Alphabetical order for pagecards in mobile mode
  • Dark/light toggle outside super admin config
  • "Lock view in runtime" option (ProductionLine)
  • Recipe: insert / delete + standardization
  • User component model library
  • Add / edit tags from any widget
  • PLC tag state feedback for buttons (confirmation)
  • PLC API write log (7 rolling days)
  • Show active loggers list + stop from button
  • Regular PLC health check in display + loss alerts
  • Crash report with last actions log
  • Fix camera recording
  • Use performance tool to score widgets and a full supervision page for optimization rate
QR codes, access & deployment
✅ Done
  • Licenses and rights management
  • License counter fix
⬜ To do
  • Lightweight Supervisor version (no editing)
  • Lightweight Runtime Machine version (no editing)
  • Display-only version (no write API)
  • Test LivePLC on hardened DIN rail PC / Raspberry Pi + Build compatibility list
  • Support site + GDPR documentation
  • SEO / AI search referencing + partner outreach
This list is both my logbook and my roadmap. Some items have been waiting for months; others emerge from a conversation or a problem encountered on the factory floor that same morning. One thing is certain: the learning and prediction modules represent the real qualitative leap ahead : moving from a supervision system that displays to one that predicts.